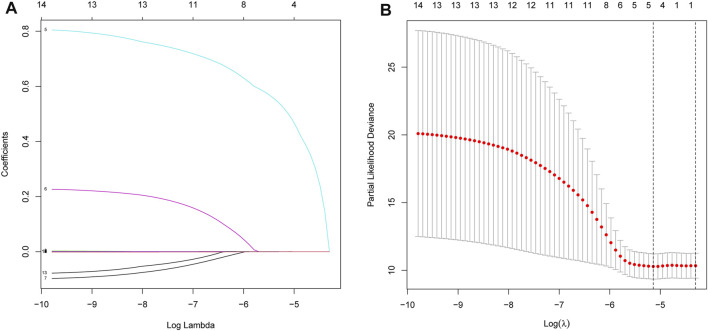
FIGURE 2.
Processes of LASSO Cox model fitting. (A). Profiles of coefficients in the model at varying levels of penalization were plotted against the log(lambda) sequence. (B). Ten-fold cross-validated error (the first and second vertical lines denote the minimum and cross-validated errors, respectively, within 1 standard error of the minimum).

