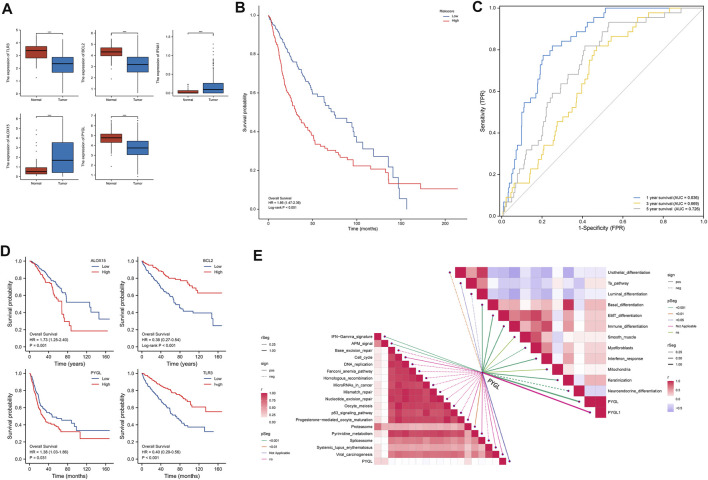
FIGURE 4.
Validation of the 5-gene signature using a validation cohort. (A). Results of qRT-PCR analysis. (B). Kaplan-Meier curves showing OS of patients in the high-risk and low-risk groups. (C). AUCs of time-dependent ROC curves indicating the prognostic performance of the risk score. (D). Kaplan-Meier curves showing OS of patients in the high- and low-expression groups of 5 DEGs. (E) Pathway analysis targeting PYGL.

