Fig. 1.
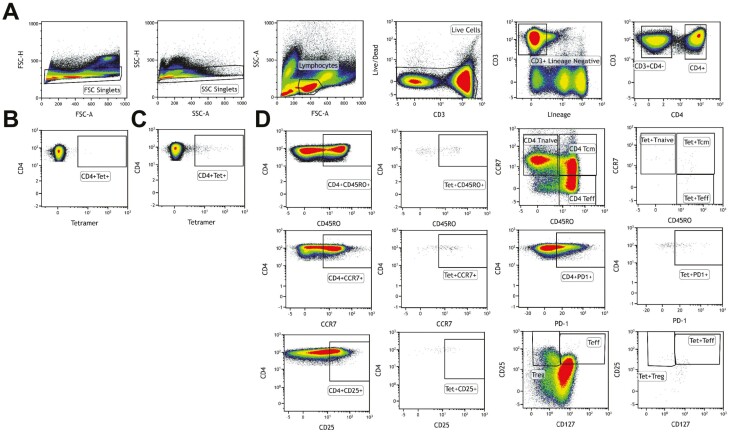
Gating strategy for tetramer analysis. (A) Live cells were gated using forward scatter (FSC) and side scatter (SSC) followed by singlets and lymphocytes. Live CD3+ cells were gated using Lineage/LIVE/DEAD marker negative and CD3+ cells. CD4+ T cells were gated from CD3+ T cells. Tet+ T cells were gated from CD4+ T cells as double positives. (B) Tetramer-negative FMO sample used to determine gating for Tet+ cells. (C) Representative sample with Tet+ staining (patient R3). (D) Based on surface markers used, subpopulation within CD4+ and Tet+ CD4+ cells were gated. The figure is representative of the evaluation assays.

