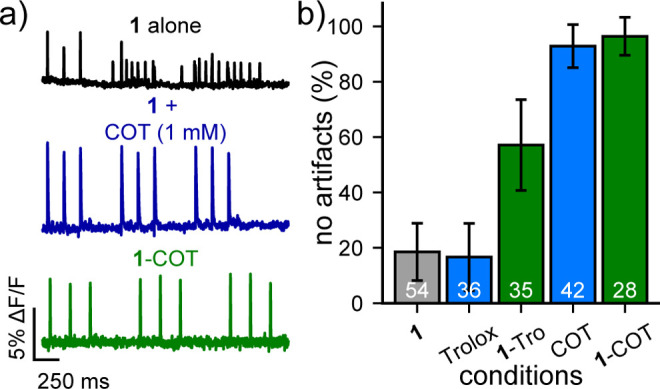
Figure 2.

TSQ-stabilized indicators prevent unwanted physiological disruption in mammalian neurons. (a) Plots of relative fluorescence (ΔF/F) vs time for neurons loaded with 500 nM of the indicated dye (1, black; 1 + 1 mM COT, blue; or 1-COT, green) and stimulated with an extracellular electrode to evoke firing. Traces are single trials and are bleach corrected using a linear fit. (b) Plot of the fraction of neurons that exhibit no experimental artifacts during the neuronal simulation protocol, including shifts in baseline, after depolarizations, or nonevoked spikes. Data are the proportion of cells without artifacts. Error bars are the 95% confidence interval. White values indicate the number of analyzed neurons per condition.
