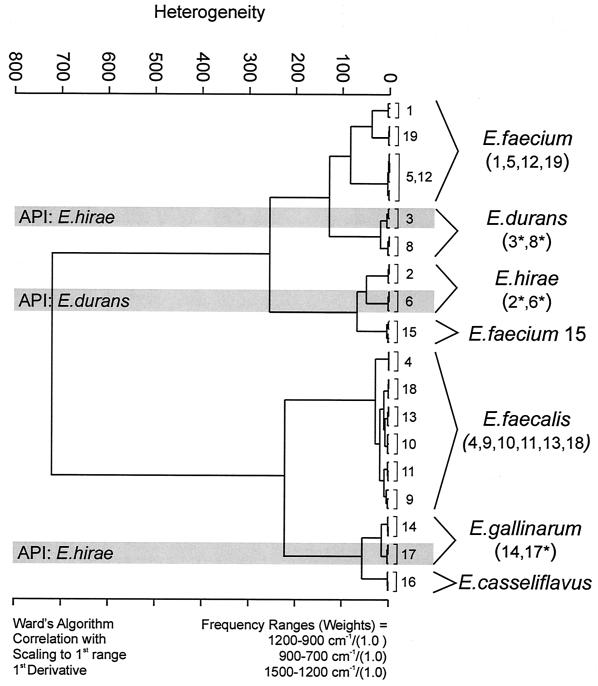
FIG. 2.
Classification scheme based on the FT-IR spectra of six different Enterococcus species. Cluster analysis of three repetitive measurements was performed using the first derivatives of the spectra, considering the spectral ranges from 1,200 to 900, 900 to 700, and 1,500 to 1,200 cm−1. All spectral ranges were equally weighted. Ward's algorithm was applied. The strains marked with an asterisk were not in accordance with the phenotypic identification by the API system. Shading highlights the identity of certain strains by the API system.

