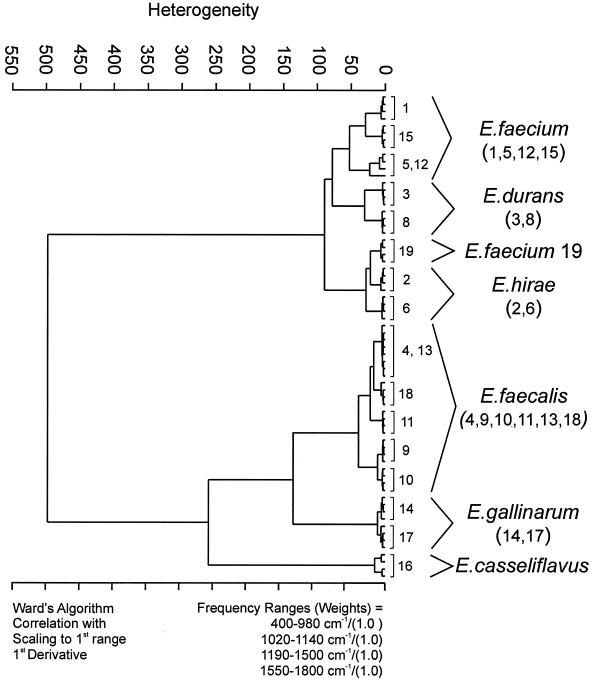
FIG. 4.
Classification scheme based on the Raman spectra of six different Enterococcus species. Cluster analysis of four repetitive measurements was performed using the first derivatives of the spectra, considering the spectral ranges from 400 to 980, 1,020 to 1,140, 1,190 to 1500, and 1,500 to 1,800 cm−1, with the aim of excluding the spectral features that are caused by the carotenoid pigmentation of E. casseliflavus strain 16 and E. hirae strain 6. All spectral ranges were equally weighted. Ward's algorithm was applied.

