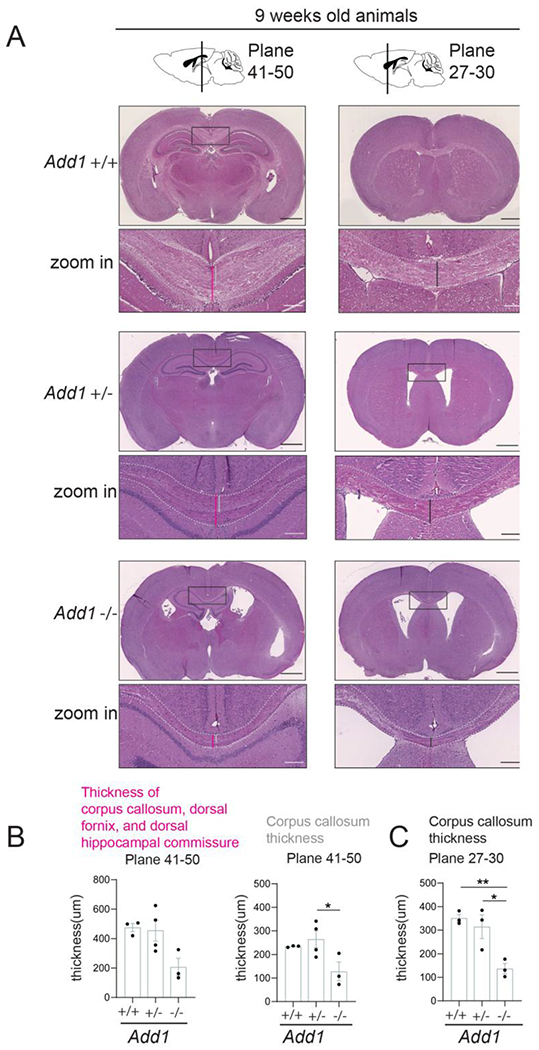
Figure 5. Corpus callosum thickness is decreased in adult mice in the absence of Add1.

A) Hematoxylin and eosin staining of brain coronal sections from adult wild-type (Add1 +/+), heterozygous (Add1 +/−), and knock-out (Add1 −/−) Adducin1 animals. Scale bar: 500 μm; zoom-in scale bar: 100 μm.
B) Quantification of the thickness of corpus callosum, dorsal fornix, and dorsal hippocampal commissure (indicated by pink lines in A)) and of corpus callosum only (indicated by grey lines in A)) in coronal brain plates 41-50. Data represent mean ± SEM (n = 3-4 animals/condition). *P < 0.05 by 1-way ANOVA with Tukey’s post hoc test.
C) Quantification of corpus callosum thickness (indicated by black lines in A)) in coronal brain plates 27-30. Data represent mean ± SEM (n = 3 animals/condition). *P < 0.05, **P < 0.01 by 1-way ANOVA with Tukey’s post hoc test.
See also Figure S5.
