Figure 3.

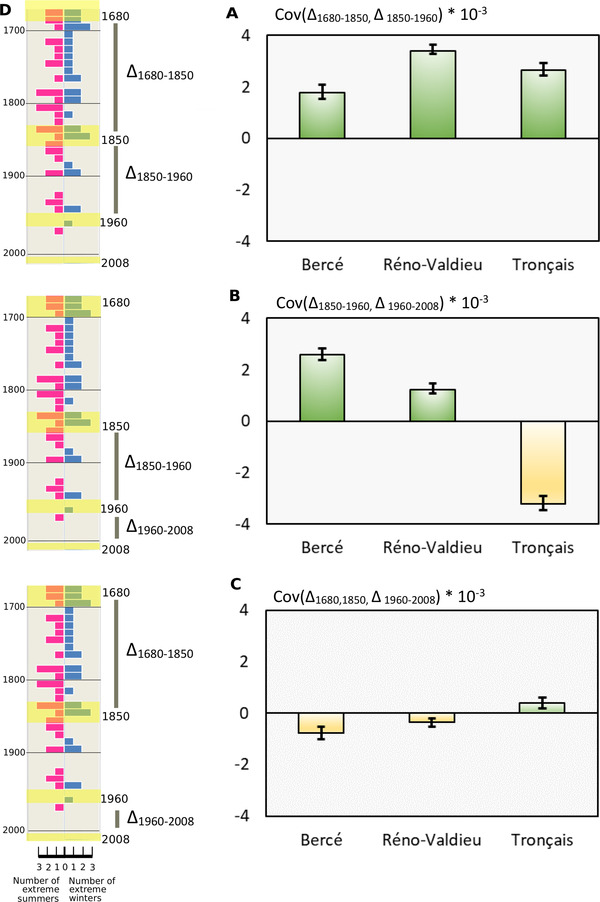
Temporal covariances of allelic frequency changes between different time periods and occurrences of extreme climatic events since the Little Ice Age. Mean and 95% confidence intervals of the covariances were obtained by bootstrapping with 5000 iterations. (A) Temporal covariances of allelic frequency changes between 1680–1850 and 1850–1960 in the three forests. (B) Temporal covariances of allelic frequency changes between 1850–1960 and 1960–2008 in the three forests. (C) Temporal covariances of allelic frequency changes between 1680–1850 and 1960–2008 in the three forests. (D) Timeline subdivided in decades. On the right side of the timeline in blue bars, number of extreme winters per decade according to instrumental temperatures recorded at the Observatory of Paris between 1676 and 2010 (Rousseau 2012) (more details in Fig. S2). On the left side of the timeline in red bars, number of extreme summer droughts per decade according to Cook's data base of Old World megadroughts (Palmer 1965; van der Schrier et al. 2013; Cook et al. 2015) (for more details, see Fig. S3). Highlighted decades in yellow correspond to periods when the cohorts became installed after natural regeneration.
