
Figure 4.
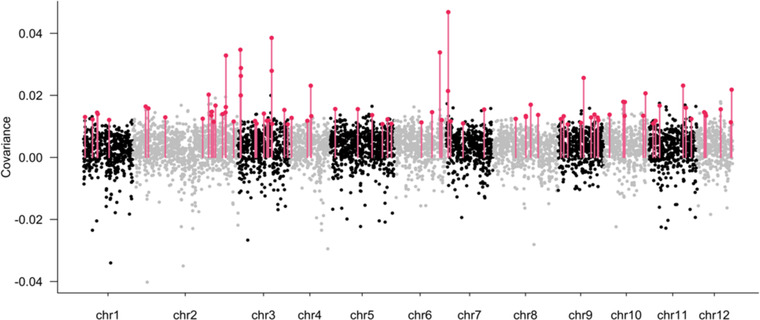
Manhattan plots of the temporal covariances of allelic frequency changes between the two oldest time periods ((Δ1680‐1850, Δ1850‐1960)) calculated at the tile level, over the whole genome. Black dots correspond to the mean covariance over the three forests. Outliers tiles (red bars) are tiles for which covariances are larger than 0.01 in each of the three forests.