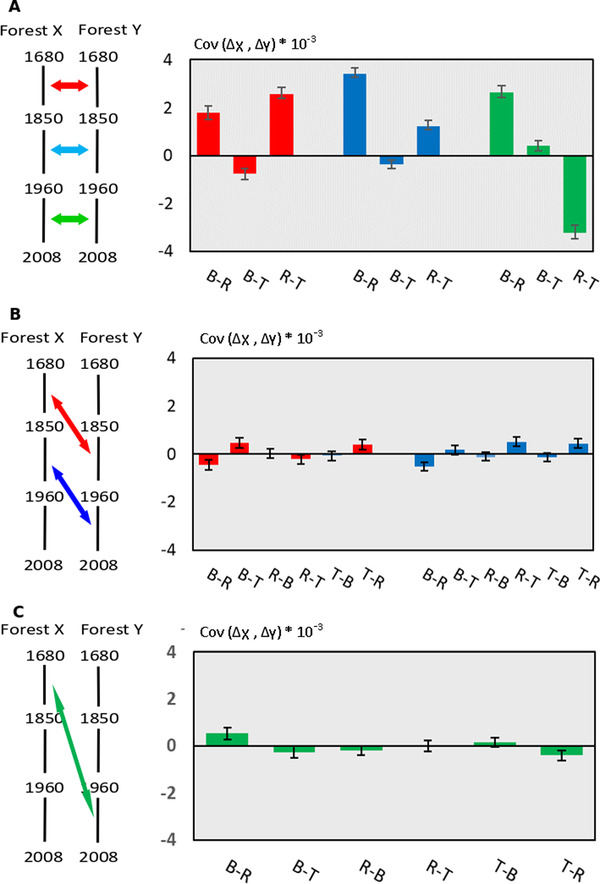
Figure 5.

Temporal covariances of allelic frequency changes between the different forests for different time periods. Mean and 95% confidence intervals of the covariances were obtained by bootstrapping with 5000 iterations. Colors of the arrows on the left diagram indicate the time periods considered in the graphs. B: Bercé, R: Réno‐Valdieu, T: Tronçais. (A) Temporal covariances of allelic frequency changes between forests for contemporary time periods. (B) Temporal covariances of allelic frequency changes between forests for adjacent time periods. (C) Temporal covariances of allelic frequency changes between forests for distant time periods.
