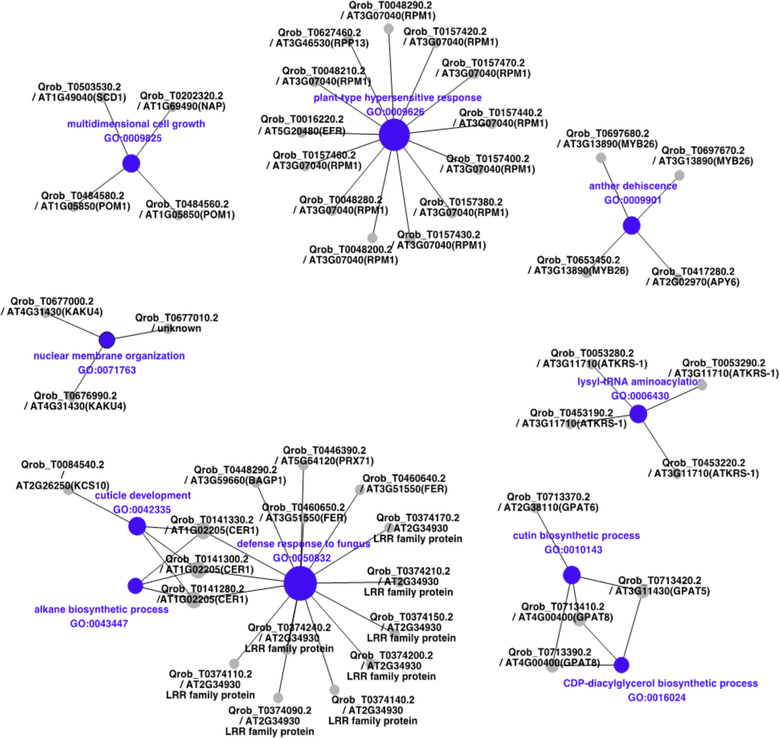
Figure 7.

Network plot of the 10 most significant Biological Process (BP terms from gene ontology enrichment analysis). The size of the nodes is proportional to their degree of connectivity. The labels correspond to the name of the Quercus robur gene model followed by the locus name of the best Arabidopsis homolog and the corresponding Arabidopsis gene name (from TAIR: https://www.arabidopsis.org/) between brackets when available. When no gene name exists, a short description (from TAIR or EggNOG databases) is added. If no description is available, the description is set to “unknown.”
