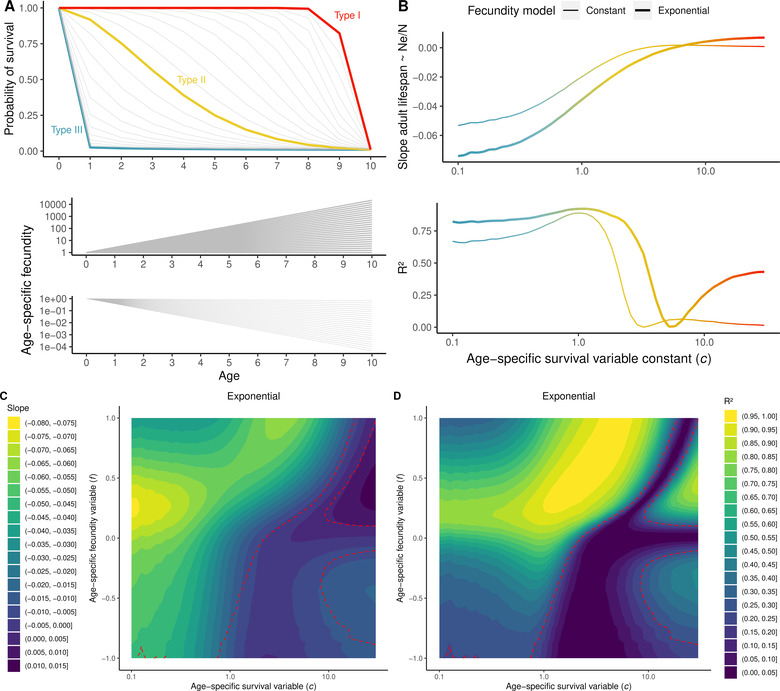
Figure 4.

Slope of the linear model between adult lifespan and ratio estimated with AgeNe for different combinations of age‐specific survival and fecundity. (A) On top, gradient of survivorship curves simulated, ranging from type III (blue, ) characterized by high juvenile mortality and low adult mortality; to type II (orange, around 1), constant mortality and type I (red), low juvenile mortality and high adult mortality. At the bottom, simulated fecundity either increases or decreases exponentially with age following , with ranging from −1 to 1. Sixteen simulated life tables were constructed with the same values of age at maturity and lifespan as the 16 studied species, and all possible survivorship curves and fecundity‐age relationships shown in Panels A and B). Slope and of the regression between adult lifespan and ratio for the 16 simulated species as a function of , for constant fecundity with age (thin line) and exponential increase of fecundity with age with (thick line). (C) Slope and (D) of the regression between adult lifespan and ratio for the 16 simulated species for a gradient of values of and . In (C), warmer colors indicate steeper negative slopes; in (D) higher .
