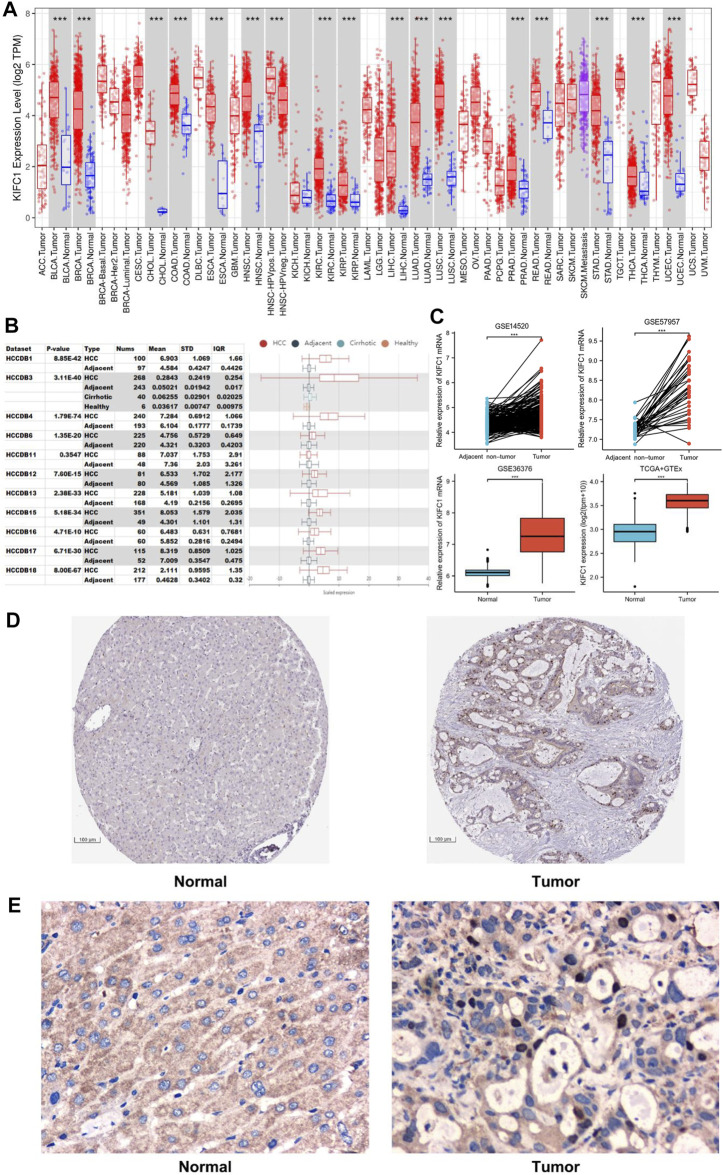
FIGURE 1.
The expression level of KIFC1 in LIHC from different databases. (A) KIFC1 expression levels in different tumor types in TIMER. (B) KIFC1 expression in tumor tissues and the adjacent normal tissues in HCCDB. (C) KIFC1 mRNA expression difference in LIHC and adjacent non-cancerous or normal liver tissues from GSE14520, GSE57957, GSE36376. and TCGA. (D) IHC profile of KIFC1 protein expression in normal and LIHC tissues from HPA database. (E) Typical IHC staining of KIFC1 protein expression in normal and LIHC tissues from clinical samples. The p-value was calculated using Student’s t-test. *p < 0.05, **p < 0.01, ***p < 0.001.

