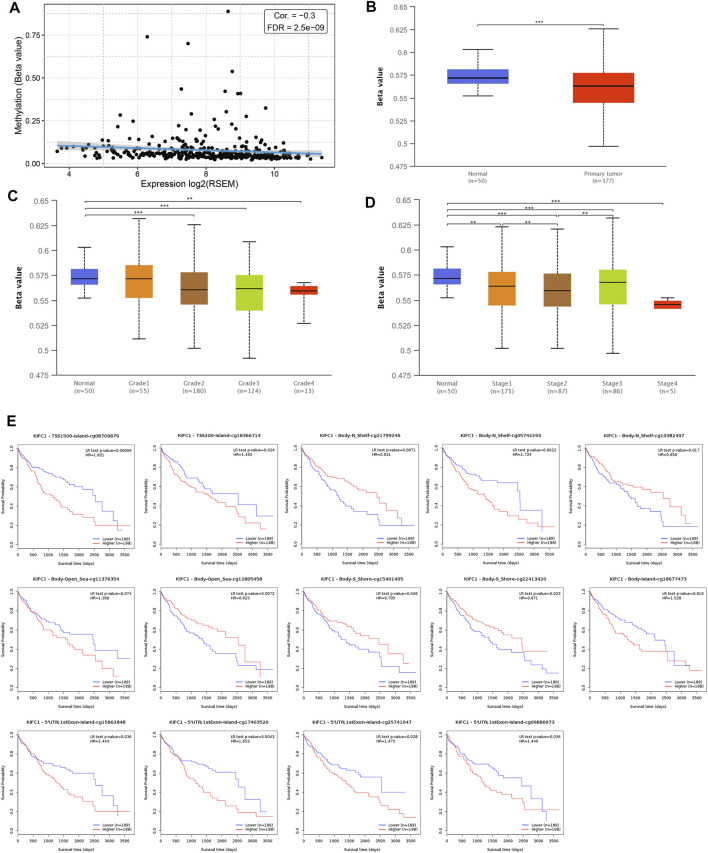
FIGURE 4.
Association of KIFC1 methylation level and its expression in LIHC. (A) Correlation between KIFC1 methylation and its expression level. (B) The promoter methylation level of KIFC1 in LIHC and normal tissues. (C, D) The correlation between promoter methylation level of KIHC1 with different grade and tumor stages. (E) The impact of different methylation sites of KIFC1 on OS of LIHC patients analyzed by MethSurv webtool. The p-value was calculated using Student’s t-test. *p < 0.05, **p < 0.01, ***p < 0.001.

