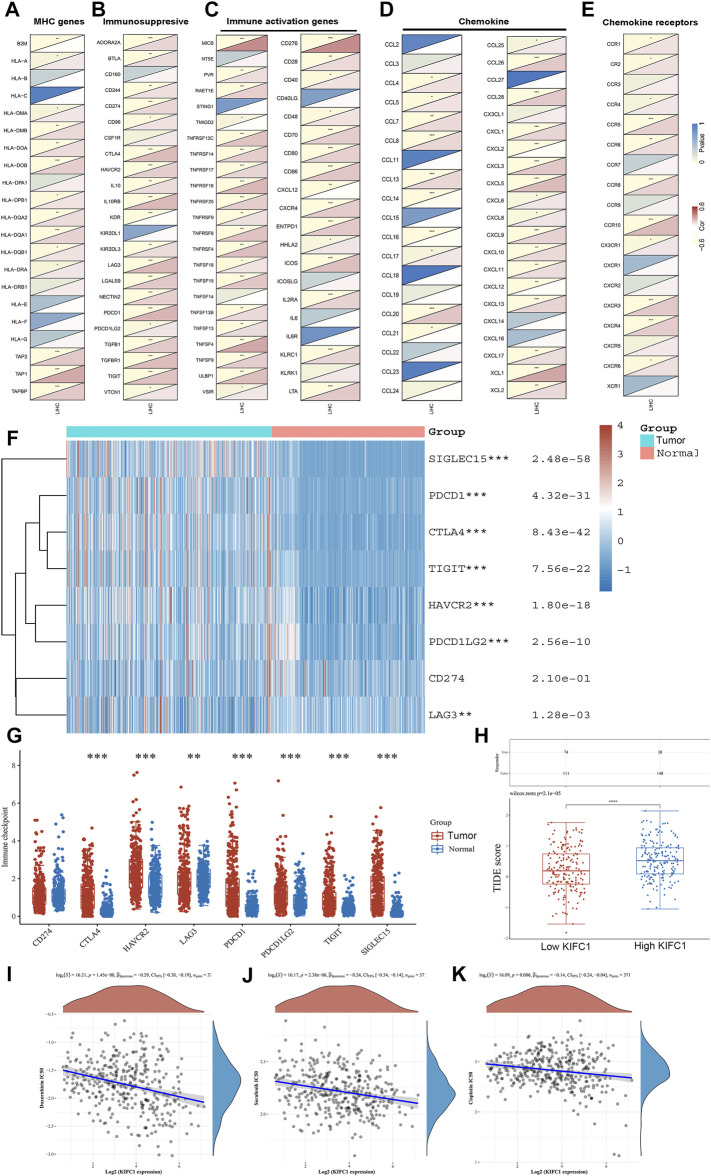
FIGURE 6.
Co-expression of KIFC1 with (A) MHC, (B) immunosuppressive, (C) immune activation, (D) chemokine, and (E) chemokine receptor genes. (F, G) Different expressions of immune checkpoints in LIHC and normal patients. (H) Different responses to ICB therapy in low and high KIFC1 expressions. (I–K) Correlations between KIFC1 and the IC50 of chemotherapy drugs. *p < 0.05, **p < 0.01, ***p < 0.001.

