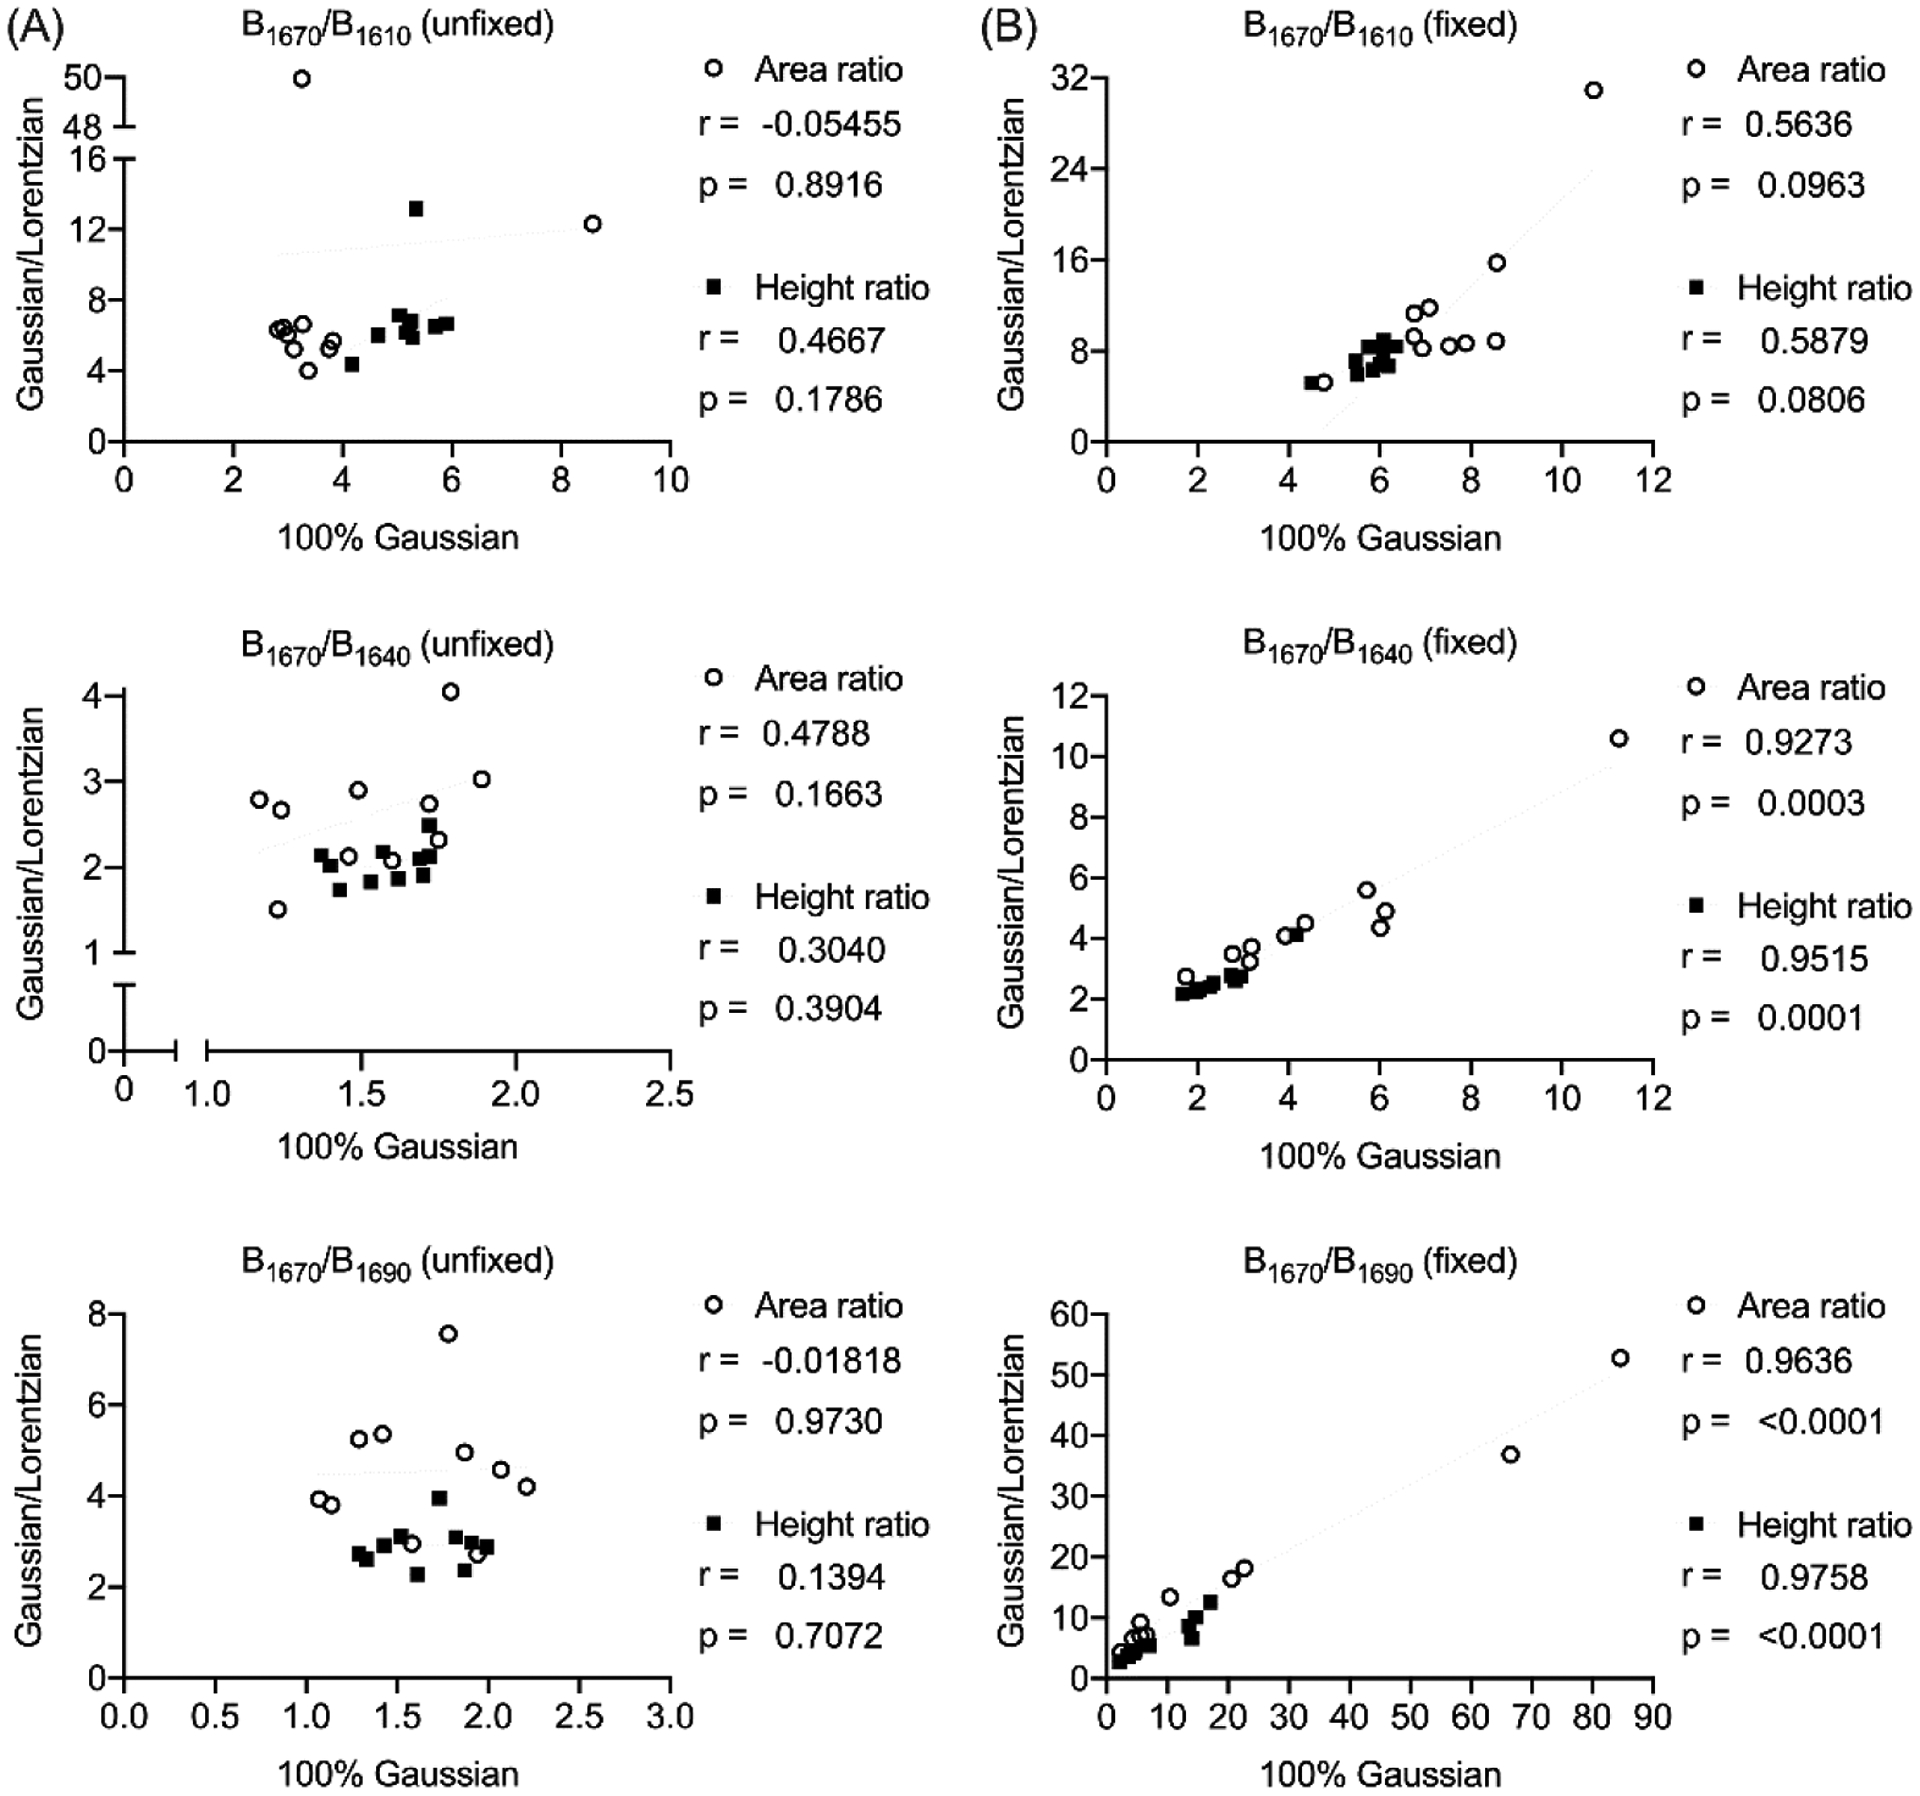
Figure 10. Sub-peak ratio correlations between 2 deconvolution methods.

When the sub-bands are allowed to move during the fitting process, 100% Gaussian curves do not produce sub-peak ratios that correlate with their corresponding sub-peak ratio as determined by a blend of Gaussian and Lorentzian functions (A). On the other hand, when fixing the position of the sub-bands to the local minima of the 2nd derivative spectrum, the 2 different deconvolution methods determine sub-peak ratios that correlate, at least for 2 of the 3 ratios that were selected (B). This is not a justification for fixing the positions during the curve fits, but rather the choice of selecting Gaussian vs. Guassian/Lorentzian functions is less problematic when the positions of the sub-bands are fixed. P-value is provided for each Spearman’s correlation coefficient (r).
