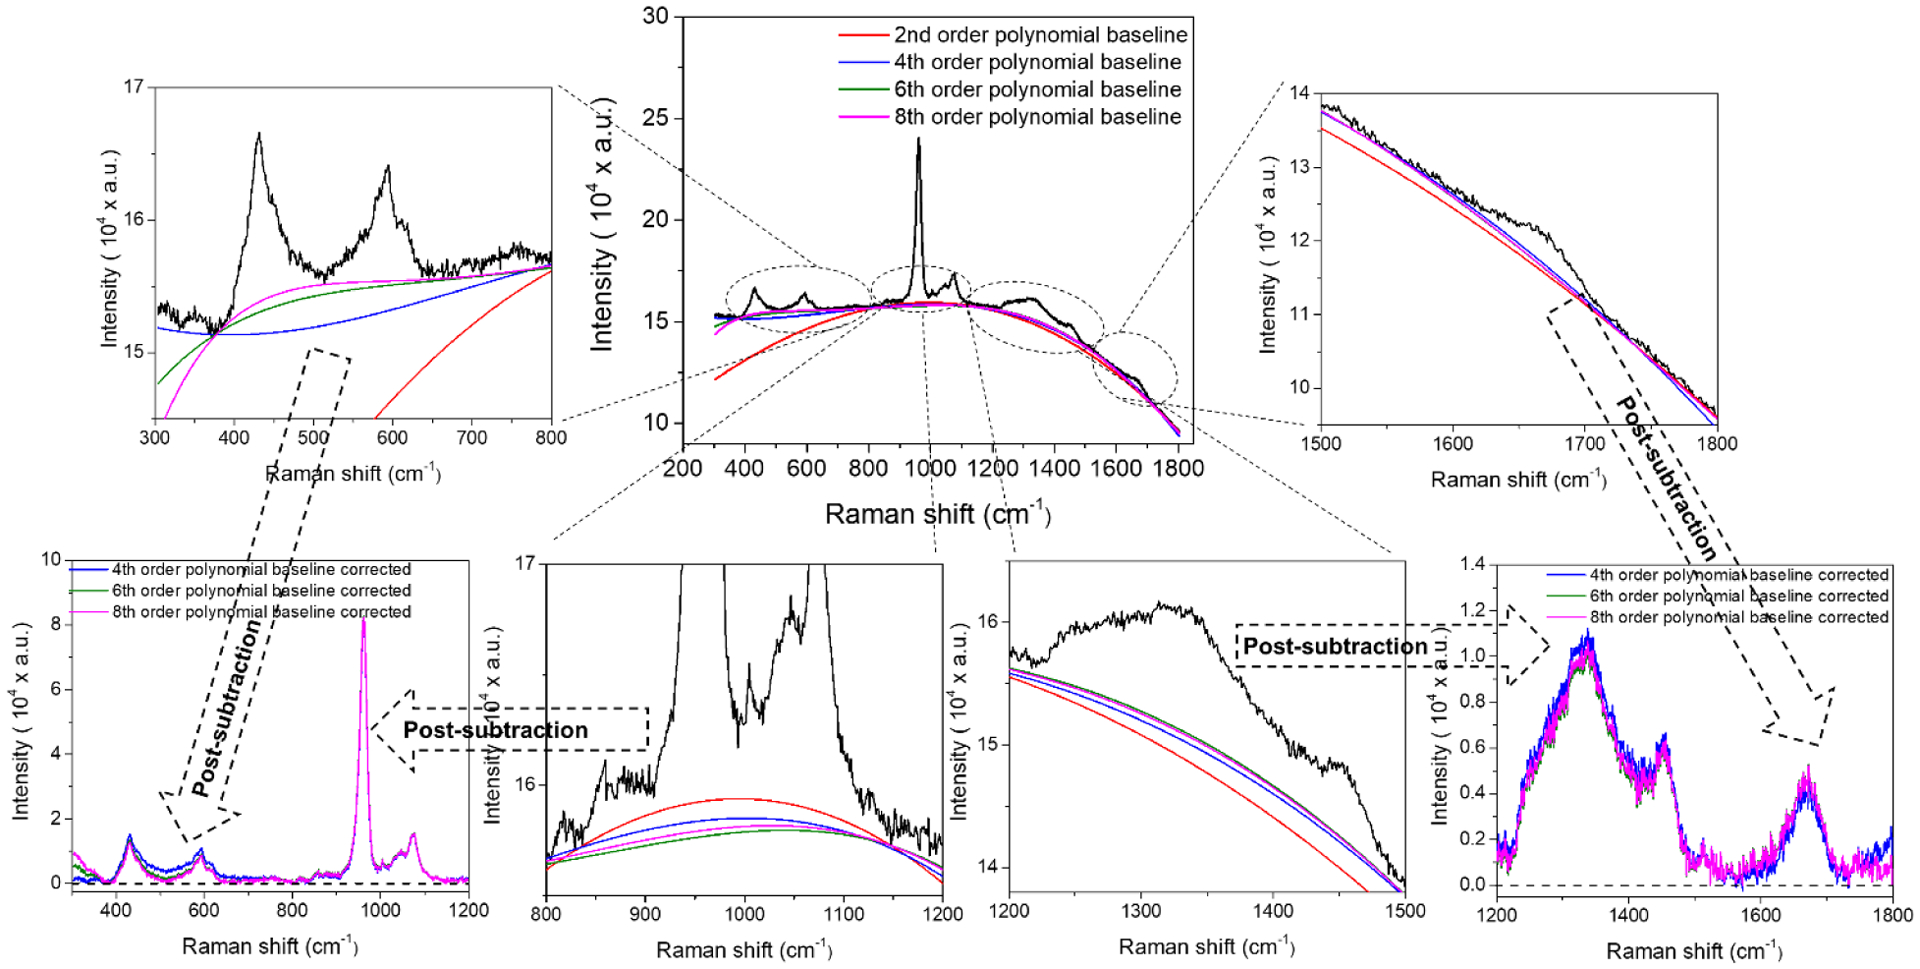
Figure 6. Effect of polynomial order on the fit of the non-linear curve to the apparent baseline of a Raman spectrum of bone.

Because bone tissue contains fluorophores that auto-fluoresce upon exposure to laser light, all raw Raman spectra of bone have background fluorescence that obscures the relative of heights of various peaks. To remove or subtract the background fluorescence, a polynomial curve of some specified order (e.g., quartic) is fit to the apparent baseline of the Raman spectrum. Selecting too low of an order (e.g., a*x2 + b*x + c) or too high of an order (a*x10 + b*x9 + c*x8 + d*x7 + e*x6 + f*x4 + g*x3 + h*x2 + i*x2 + j*x + k) under-fits certain regions of the spectrum or over-fits the polynomial baseline curve. The poor fit at the extreme ends of the Raman shift can be ignored if the region does not contain important peaks (i.e., can be truncated after removing background fluorescence).
