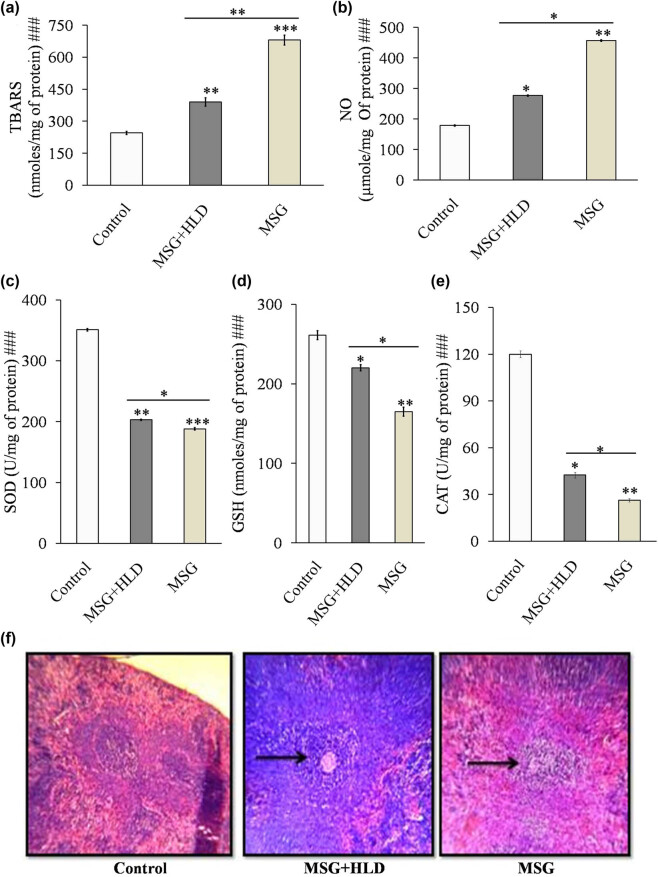
Figure 4.
MSG with or without HLD induced changes in lipid peroxidation (a), NO (b), SOD (c), GSH (d), CAT (e), and spleen tissue architecture (f). Black pointed arrows indicate the degree of injury in spleen tissue by MSG or MSG + HLD. Significance level based on Kruskal–Wallis test [###P < 0.001]. Control vs MSG and Control vs MSG + HLD: ***P < 0.001, **P < 0.01 and *P < 0.05.

