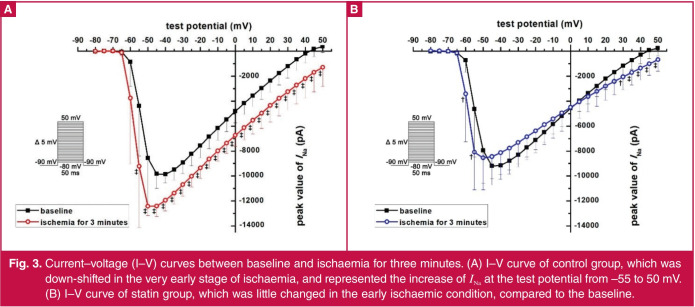
Fig. 3.
Current–voltage (I–V) curves between baseline and ischaemia for three minutes. (A) I–V curve of control group, which was down-shifted in the very early stage of ischaemia, and represented the increase of INa at the test potential from –55 to 50 mV. (B) I–V curve of statin group, which was little changed in the early ischaemic condition, compared to the baseline.

