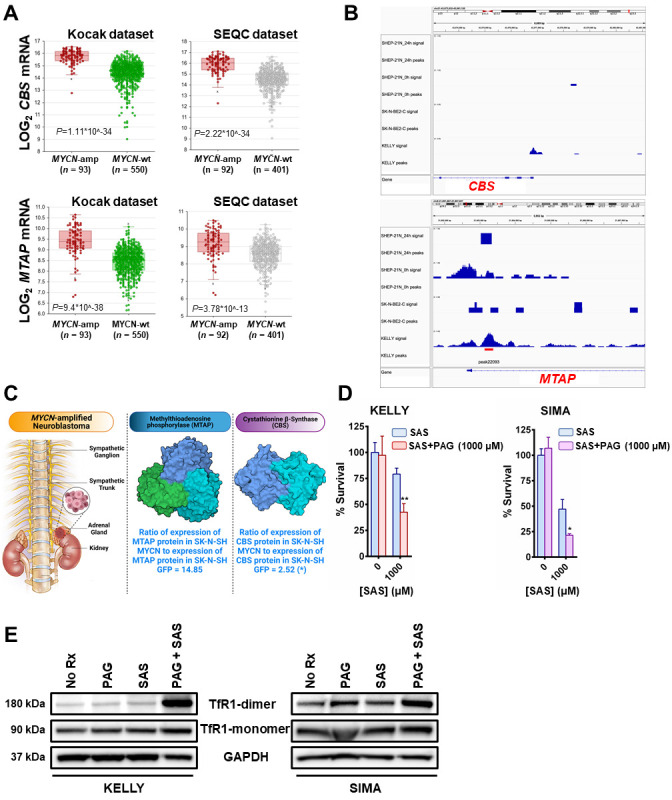
Figure 2. FIGURE 2: MYCN induces the transsulfuration pathway to further protect neuroblastomas from ferroptotic cell death.

(A) Box plots from datasets obtained from R2 platform demonstrating differential RNA expression of CBS and MTAP enzymes in MYCN-amplified neuroblastoma tumors compared with MYCN-wt neuroblastoma tumors. Mann–Whitney test was performed. (B) MYCN signal in the promoters of MTAP and CBS genes in the corresponding neuroblastoma cell lines. 24 h - signal post MYCN shutdown. Signal tracks were scaled to the same range for comparison. Red bar represents statistically significant MYCN binding in the MTAP promoter and lack of binding in the CBS promoter. (C) Fold-change in the expression levels of CBS and MTAP proteins between SK-N-SH MYCN and SK-N-SH GFP cells analyzed by LC-MS. Three biological replicates have been used for the mass spec analysis. For statistical significance ANOXA test was performed. The data has been included in supplemental material (Table 1S). For the 3D structures of MTAP and CBS molecules the Protein Data Bank (PDB) was used. More specifically, for the MTAP molecule, PDB ID: 3OZE [36] and for the CBS molecule, PDB ID: 1JBQ [37]. (D) The MYCN-amplified neuroblastoma cell lines KELLY and SIMA were treated with 0 and 1000 μM of sulfasalazine (SAS) with or without 1mM propargylglycine (PAG) for 36 h (KELLY) and 24 h (SIMA) and cell viability was assessed by CellTiter-Glo (n=3; error bars, +SD). (E) Whole-cell lysates were prepared from KELLY and SIMA cells that were treated overnight with (i) no drug (No Rx), (ii) 1mM propargylglycine (PAG), (iii) 1mM sulfasalazine (SAS) and (iv) their combination, subjected to western blotting, and probed for the indicated proteins. For D, Student t test was performed, and P values were corrected for multiple testing using Bonferroni method. For all statistical considerations differences were considered statistically significant if P < 0.05. For all calculated P values: *, P < 0.05; **, P < 0.01.
