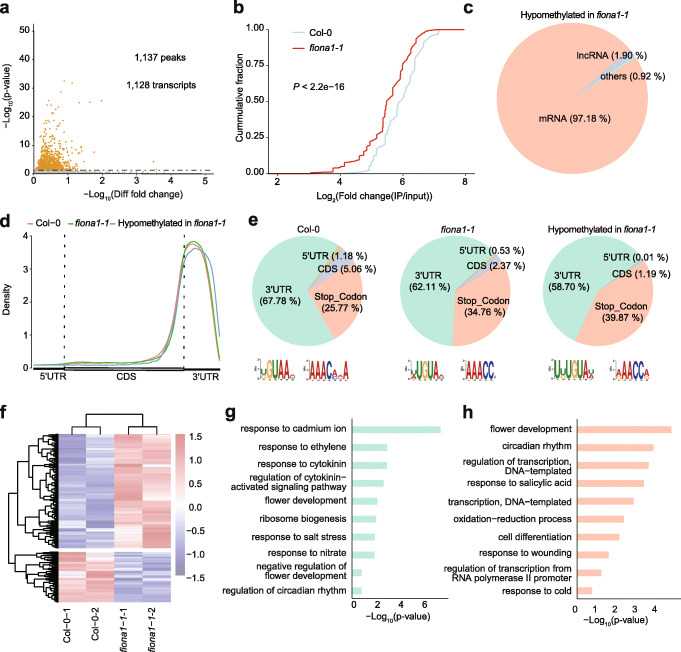
Fig. 5.
Disruption of FIONA1 leads to transcriptome m6A hypomethylation. a Volcano plot of the hypomethylated m6A peaks identified in fiona1-1 across three biological replicates. b Cumulative fraction of log2 (m6A enrichment fold change) for the hypomethylated m6A peaks in fiona1-1 and Col-0. Pie chart presenting RNA types of the confident hypomethylated m6A peaks identified in fiona1-1. d Metagene profile presenting the distributions of m6A peaks identified in Col-0 and fiona1-1 and the hypomethylated m6A peaks in fiona1-1 across the indicated mRNA segments. e Pie chart presenting the fractions of m6A peaks identified in Col-0 and fiona1-1 and the hypomethylated m6A peaks in fiona1-1 among non-overlapping transcript segments and the MEME-identified motifs for those m6A peaks. f Heatmap showing differentially expressed genes in two biological replicated Col-0 and fiona1-1 seedlings. g GO analysis of the hypomethylated m6A containing genes in fiona1-1. h GO analysis of the differentially expressed genes in fiona1-1 compared with Col-0

