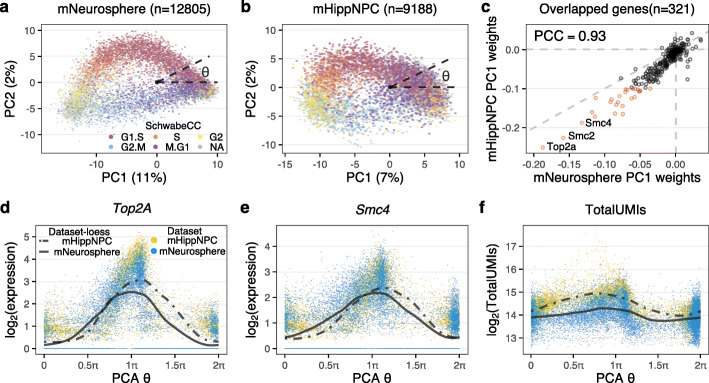
Fig. 2.
The cell-cycle ellipsoid and cell-cycle position. a Top 2 principal components of GO cell-cycle genes from E14.5 primary mouse cortical neurospheres, in which the variation is primarily driven by cell cycle. Each point represents a single cell, which is colored by 5-stage cell-cycle representation, inferred using the SchwabeCC method [15]. The cell-cycle position θ (with values in [0,2π); sometimes called cell-cycle pseudotime) is the polar angle. b As in (a), but for a dataset of primary mouse hippocampal progenitor cells from both a mouse model of Kabuki syndrome and a wildtype. c A comparison of the weights on principal component 1 between the cortical neurosphere and hippocampal progenitor datasets. Genes with high weights (|score|>0.1 for either vector) are highlighted in red. PCC: Pearson Correlation Coefficient. d, e The expression dynamics of dTop2A and eSmc4 using the inferred cell-cycle position, with a periodic loess line (see the “Methods” section). f The dynamics of total UMI using the inferred cell-cycle position, with a periodic loess line, illustrating the high agreement of the dynamics between datasets

