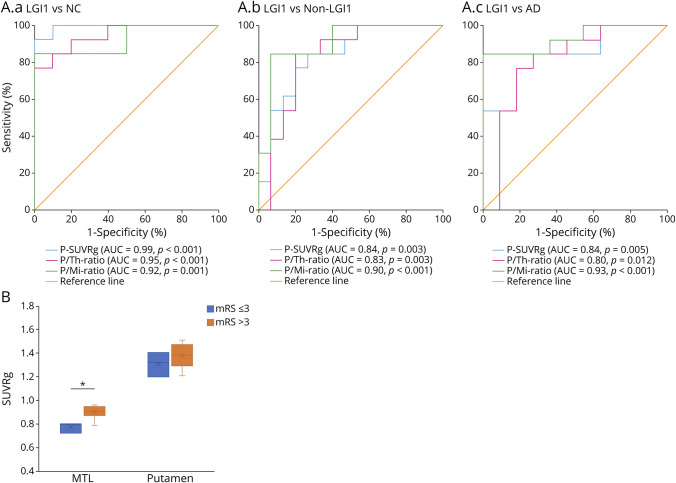
Figure 2. Diagnostic Accuracy of Putaminal-[18F]FDG Indices and Relationship of Mediotemporal and Putaminal Dysmetabolism With mRS in LGI1-AE.
(A.a–c) Receiver operating characteristic (ROC) curve analyses of [18F]FDG putaminal indices for the evaluation of their accuracy in differentiating patients with LGI1-AE from NCs (A.a), non–LGI1-AE group (A.b) and AD group (A.c). All p values are significant at the level of p < 0.05. (B) Comparison of mediotemporal and putaminal metabolic activity, measured as global brain normalized standardized uptake value ratios (SUVRg) of [18F]FDG, in LGI1-AE group with mild-to-moderate disability (mRS ≤ 3) vs moderately severe-to-severe disability (mRS > 3) at the time of the initial [18F]FDG-PET. *p < 0.05 (significant at the level of p < 0.05). [18F]FDG = [18F]fluorodeoxyglucose; AD = Alzheimer disease; AE = autoimmune encephalitis; AUC = area under the curve; LGI1 = leucine-rich, glioma–inactivated-1; Mi = midbrain; mRS = modified Rankin scale; MTL = mediotemporal lobe; NCs = negative controls; non-LGI1 = non-LGI1 autoimmune encephalitis; P = putamen; SUVRg = global brain normalized SUV ratio; Th = thalamus.

