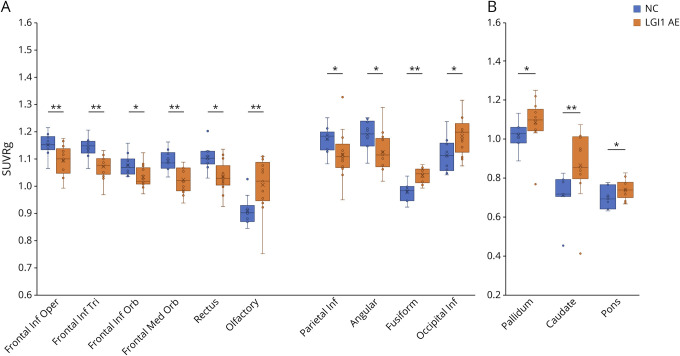
Figure 3. Cortical and Subcortical Dysmetabolism Beyond Putamen and Mediotemporal Lobe in LGI1-AE.
Comparison of brain metabolism in patients with LGI1-AE (n = 13) and NCs (n = 10) in (A) cortical and (B) subcortical regions of interest. *p < 0.05, **p < 0.01 (significant at the level of p < 0.05). [18F]FDG = [18F]fluorodeoxyglucose; AE = autoimmune encephalitis; Frontal Inf Oper = opercular part of inferior frontal gyrus; Frontal Inf Orb = orbital part of inferior frontal gyrus; Frontal Inf Tri = triangular part of inferior frontal gyrus; Frontal Med Orb = medial orbital part of superior frontal gyrus; LGI1 = leucine-rich, glioma–inactivated-1; NC = negative controls; occipital Inf; inferior occipital lobe; parietal Inf = inferior parietal lobe; SUVRg = global normalized standardized uptake value ratio.

