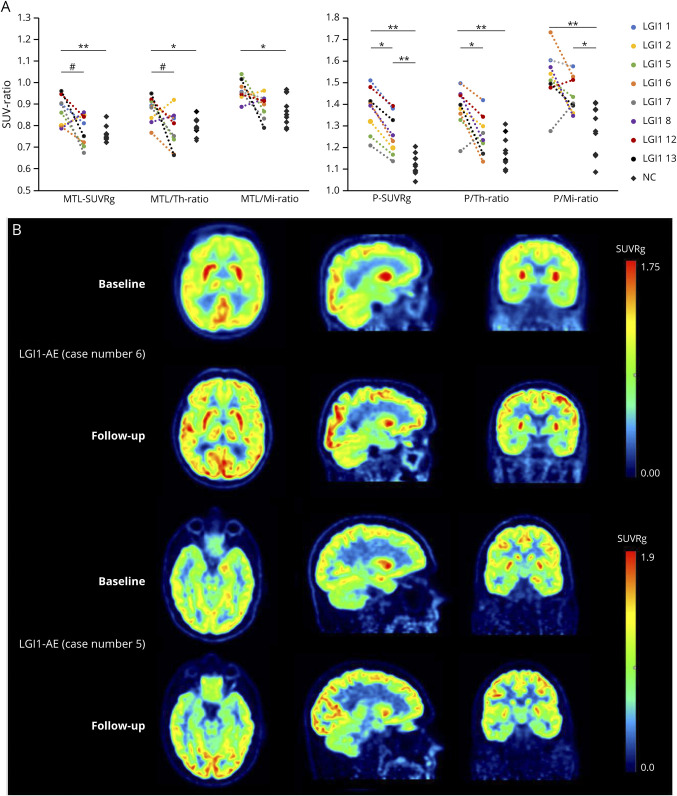
Figure 4. Longitudinal Changes in Brain Metabolism After Immunosuppressive Treatment in Patients With LGI1-AE.
(A) Individual and group-level changes in brain metabolism from baseline to short-term follow-up in LGI1-AE group (n = 8), measured with [18F]FDG PET indices in mediotemporal lobe and putamen and compared with NCs (n = 10). (B) Visualization of individual changes in brain metabolism after immunotherapy in 2 patients with LGI1-AE using parametric [18F]FDG SUVRg images. The images in (B) demonstrate decreases of the initial hypermetabolism in striatum (case 6) and mediotemporal lobe (case 5) and increases in occipital metabolism (both cases). The numbering of the LGI1 cases refers to the case numbers in Table 1. *p < 0.05, **p < 0.01 (both significant at the level of p < 0.05), #p = 0.05 (significant at the level of p = 0.05). [18F]FDG = [18F]fluorodeoxyglucose; AE = autoimmune encephalitis; LGI1 = leucine-rich, glioma–inactivated-1; Mi = midbrain; MTL = mediotemporal lobe; NC = negative control; P = Putamen; SUV = standardized uptake value; SUVRg = global brain normalized standardized uptake value ratio; Th = thalamus.

