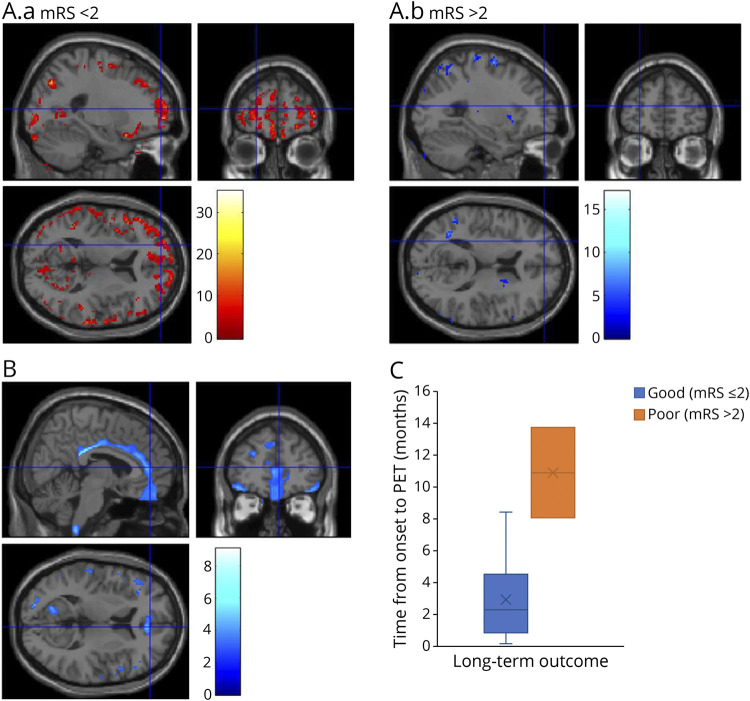
Figure 5. Associations of Cortical Metabolic Abnormalities With Longitudinal Clinical Outcomes in LGI1-AE.
(A.a–b) Changes in brain metabolism from baseline to short-term follow-up in LGI1-AE group with no significant disability (mRS < 2, n = 3) (A.a) and with moderate disability (mRS > 2, n = 3) (A.b) as the short-term clinical outcome at the time of follow-up [18F]FDG PET. Results from the statistical parametric mapping (SPM) analyses of voxel-wise [18F]FDG SUVRg images are visualized with T scores, with only voxels with significant within-group changes (threshold of T = 2.92 corresponding to uncorrected p < 0.05) shown, as denoted by the color scale bar. Voxels with significant increases are shown for the mRS < 2 group, and voxels with significant decreases are shown for the mRS > 2 group. (B) Differences in baseline brain metabolism in LGI1-AE group with good (mRS ≤ 2) vs poor (mRS > 2) long-term clinical outcome, visualized with voxel-level analysis of parametric [18F]FDG SUVRg images with SPM. The color scale bar represents voxel-level T scores, and only voxels with significant differences between groups (threshold of T = 2.76 corresponding to uncorrected p < 0.01) are shown. (C) Differences in the time from symptom onset to the initial [18F]FDG-PET between LGI1-AE group with good (mRS ≤ 2) or poor (mRS > 2) long-term clinical outcome. [18F]FDG = [18F]fluorodeoxyglucose; AE = autoimmune encephalitis; Cingulum Post = posterior cingulum; LGI1 = leucine-rich, glioma-inactivated-1; Occipital Inf = inferior occipital; Parietal Sup = superior parietal; SUVRg = global brain normalized standardized uptake value ratio.

