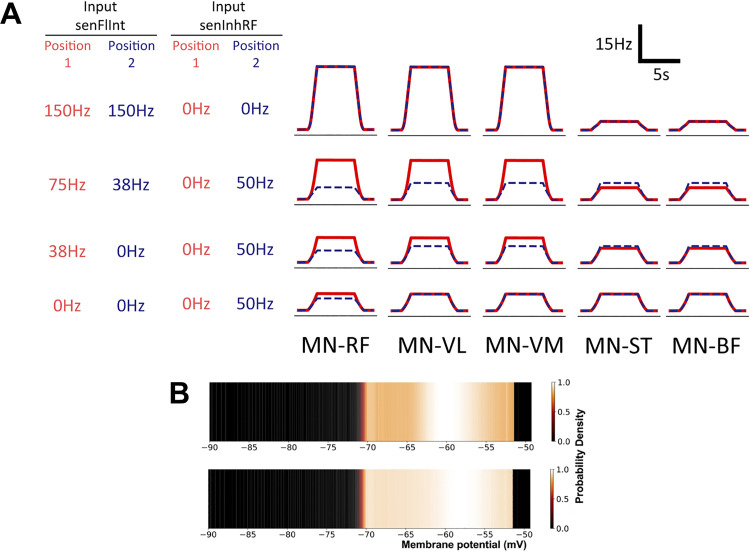
Figure 6.
A: output firing rates of the 5 simulated motor neuron (MN) populations for different levels of afferent input. The significant differences observed in the surface EMG data have been reproduced here with a nonlinear reduction in activity of afferent input senFlInt and with a change in afferent input senInhRF between positions. Red solid lines represent approximations for position 1. Blue dashed lines represent approximations for position 2. RF, rectus femoris; VL, vastus lateralis; VM, vastus medialis; ST, semitendinosus; BF, biceps femoris. B: the probability density function of the MN-RF population in the model before input from cortical drive (top) and during the contraction (bottom). Color brightness indicates the probability of a neuron in the population having the indicated membrane potential. The y-axis of the plots represents an arbitrary value for simple exponential integrate-and-fire neurons. A higher probability at the threshold of −51 mV indicates a higher average firing rate for the population.

