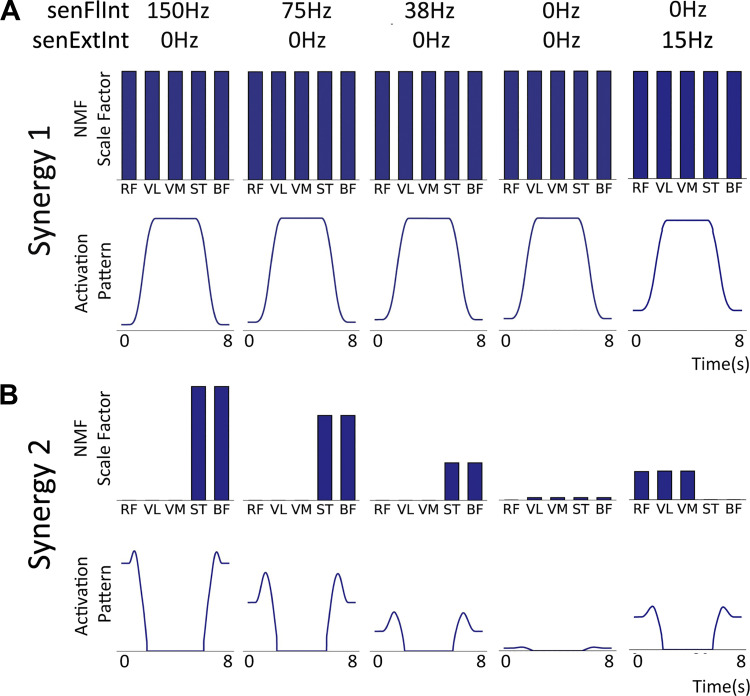
Figure 7.
Muscle synergy features extracted using rank 2 nonnegative matrix factorization (NMF) applied to the normalized average firing rates of the 5 motor neuron populations in the model for different levels of afferent senFlInt and senExtInt (Fig. 2). As with the experimental results, line plots indicate the activation pattern for each synergy and bar charts indicate that pattern’s contribution to each motor neuron population’s activity. The contribution vector values are labeled with the muscle names that correspond to the motor neuron population names. BF, biceps femoris; RF, rectus femoris; ST, semitendinosus; VL, vastus lateralis; VM, vastus medialis. A: synergy 1. The contribution vector is the same for all muscles across all levels of afferent activity. There is a small increase in the baseline of the activation pattern but the shape, caused by the cortical drive, appears at all angles. B: synergy 2. The high contribution vector values for the knee flexor populations are high when senFlInt is 150 Hz. The values reduce with afferent senFlInt, and at 0 Hz, there is effectively no synergy 2. When senExtInt is raised above senFlInt, the trend flips to an agonist bias.

