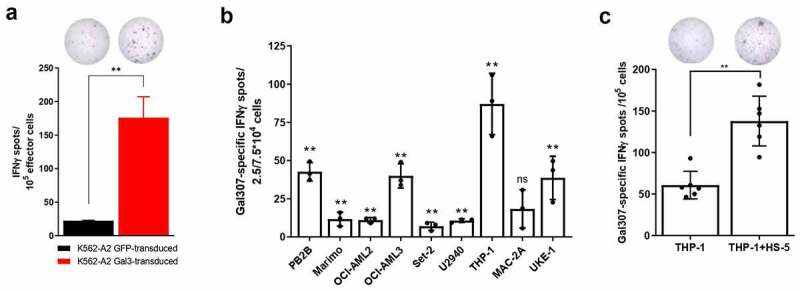
Figure 3.

Gal3-specific T cells recognize Gal3-producing cancer cells. (a, top) Representative example of IFNγ ELISPOT response of (a, bottom) enriched Gal307-specific T-cell response against K562-A2 cells transduced with Gal3 or a GFP control. 105 effector cells were used for this experiment with a 3:1 effector to target ratio. Bars represent the mean number of spots per well + SD. The experiment was performed in triplicates. (b) IFNγ ELISPOT Gal307-specific T cell responses against different HLA-A2-matched cancer cell lines after exposure to enriched Gal307-specific T cells. 2.5 × 10⁴ effector cells were used for THP-1, MAC-2A and UKE-1, while 7.5 × 10⁴ effector cells were used for the rest of the target cell lines. Both used a 3:1 effector to target cell ratio. Each dot represents the difference in mean counts of IFNγ-secreting cells between Gal307-specific T cells assayed with or without different cancer cell lines. Bars represent the mean number of spots per well -/+ SD. (c, bottom) IFNγ ELISPOT Gal307-specific T-cell responses in Gal3-specific enriched T-cell cultures against THP-1 cells cultured with or without HS-5 cells for 48 h (n = 6). 105 effector cells were used for this experiment in a 3:1 effector to target cell ratio. Each dot represents the difference in mean counts of IFNγ-secreting cells between Gal307-specific T cells stimulated with THP-1 or THP-1 in co-culture with HS-5. Bars represent the mean number of spots per well -/+ SD. (d, top) Representative examples of IFNγ ELISPOT responses shown in (c, bottom). Data shown as mean -/+ SD. Statistical analysis of single ELISPOT responses in (a) and (b) was performed with the distribution-free resampling (DFR) model. Statistical differences between groups in (c) were assessed with a Mann-Whitney test. * = p ≤ .05, ** = p ≤ .01.
