
Figure 7. MD simulation of DSPE-PEG45 in an aqueous environment.
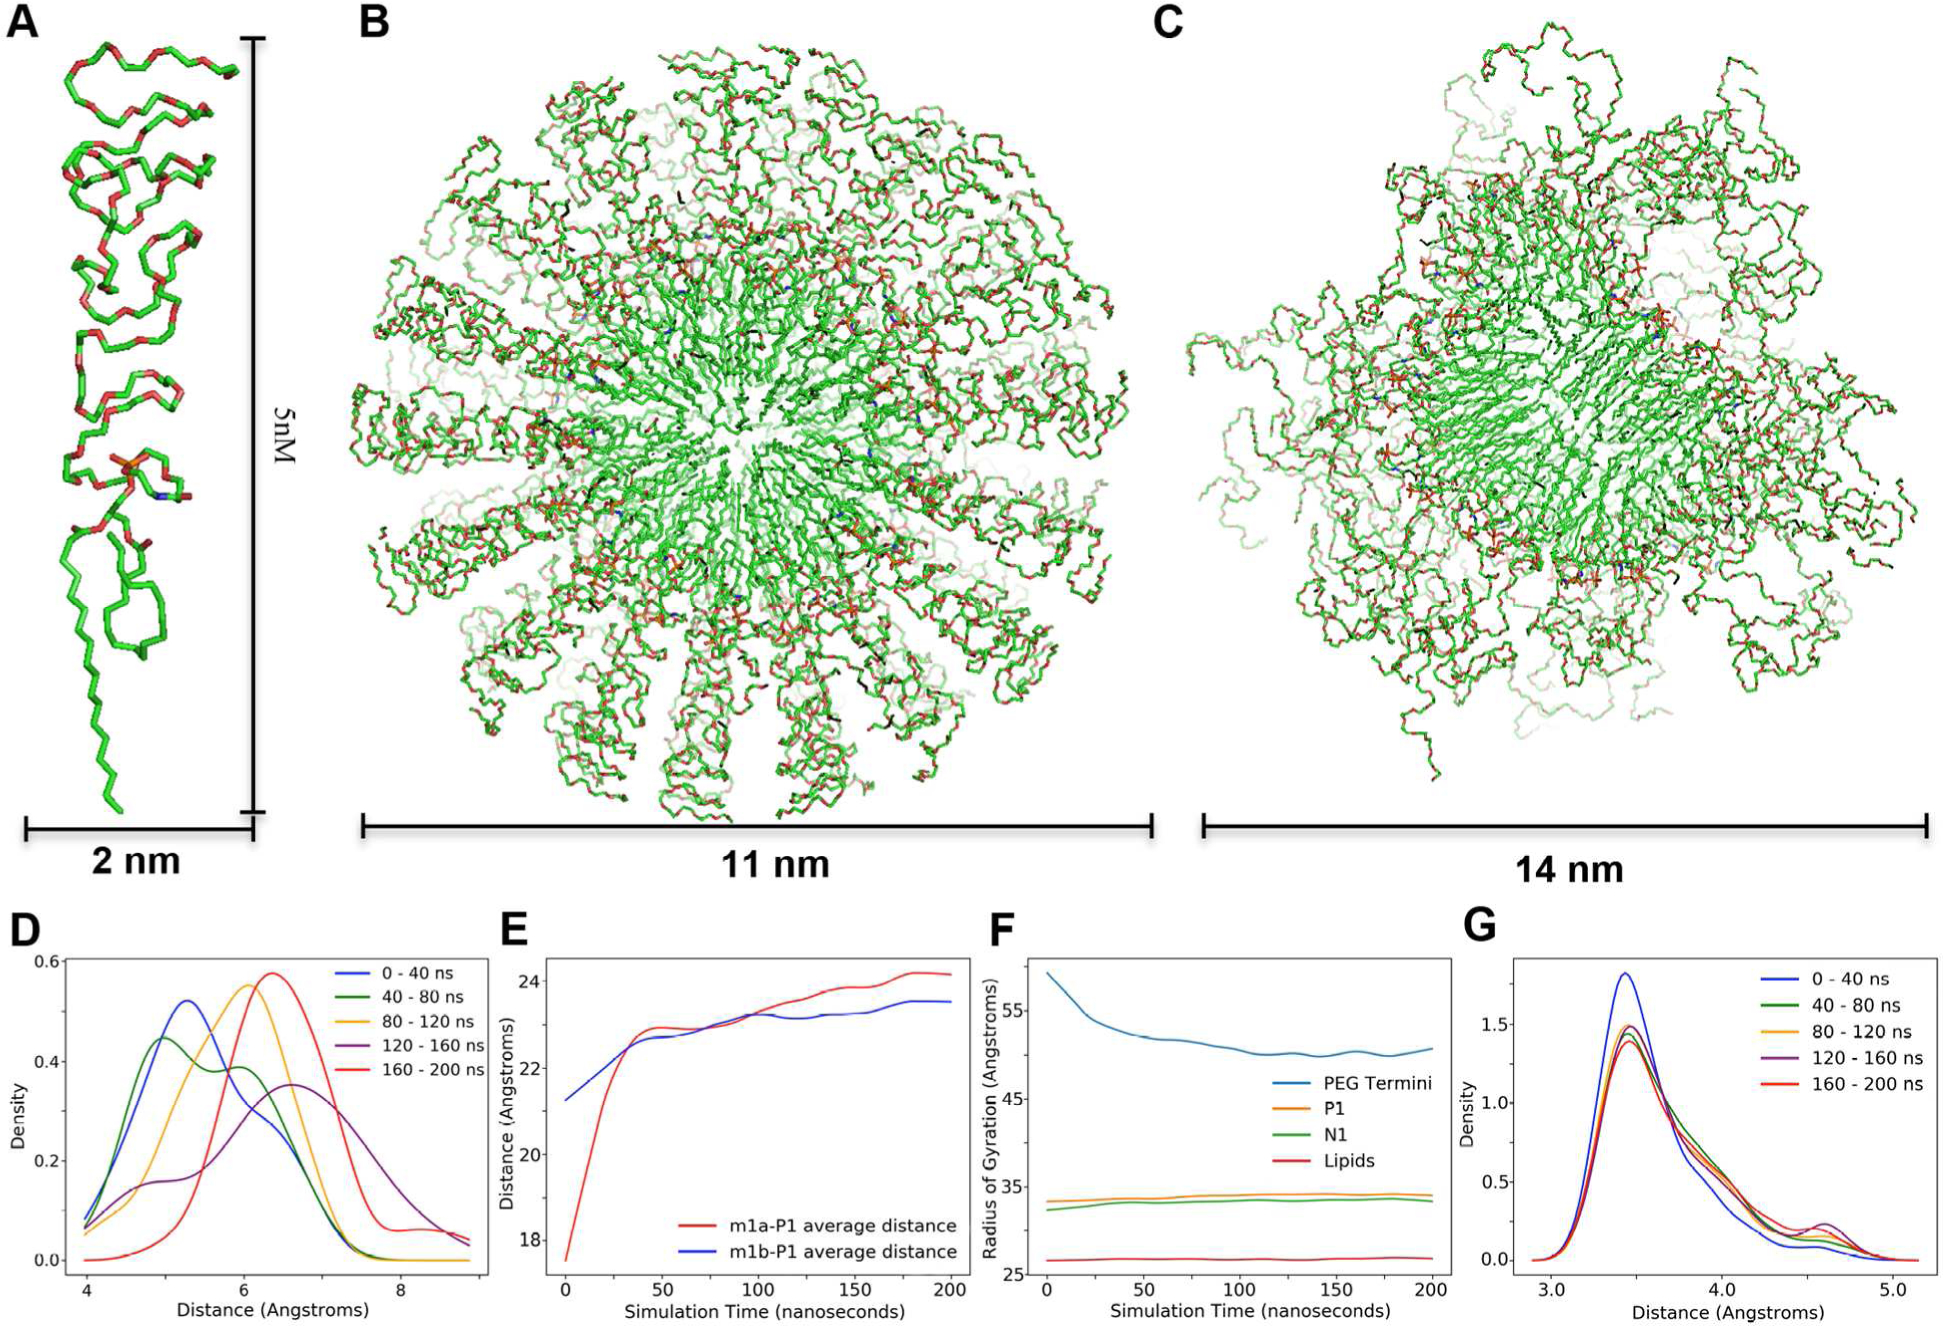
A. Monomer unit with dimensions in nanometers. B. Initial spherical micelle model with dimensions in nanometers. C. Model after MD simulation and energy minimization. D. Distance plot in 40ns periods between phosphate group and the closest lipid methyl group. E. Average distance plot over 200ns between phosphate and intra-lipid methyl group of each tail. F. Radius of gyration of different subgroups in the micelle over 200ns. G. Distance plot in 40ns periods between an oxygen on the phosphodiester and the nitrogen on the carbamate group.