
Figure 4.
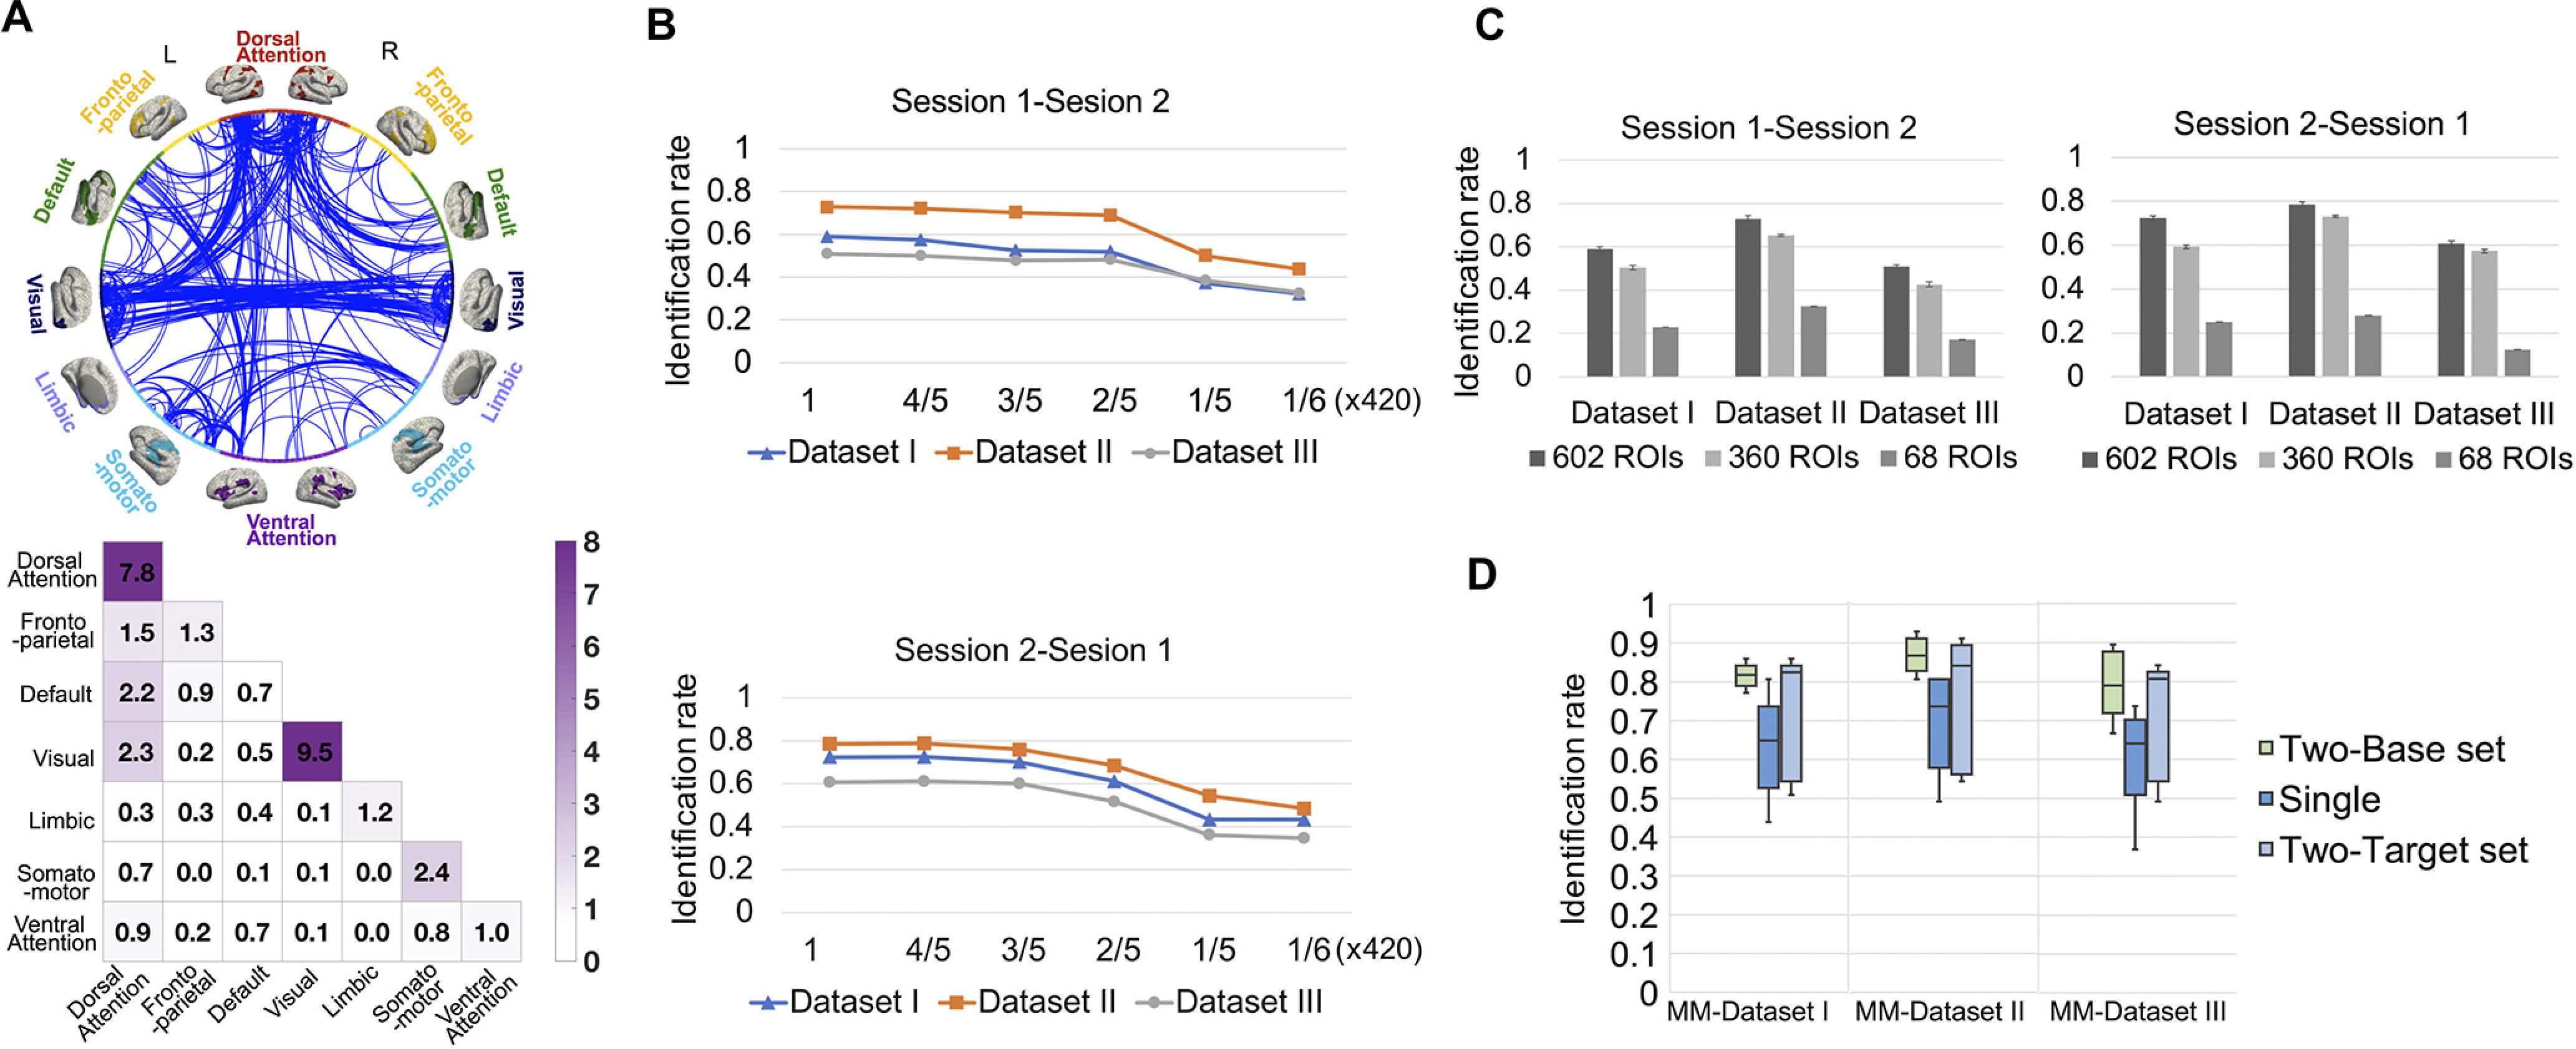
Factors affecting identification accuracy. A, Contributive edges for identification. The circle map shows the most contributive edges to identification, where the whole edge set was thresholded at the 99.9th percentile for better visualization. The 602 nodes in the whole brain are grouped into seven networks in the left (L) and right (R) hemisphere, respectively. The color (purple) in the colored matrix (bottom) shows the summed normalized contribution within and between networks. B, Identification with shorter time duration. We performed identification with a truncated rs-fMRI run, where time points with the same starting point were used to compute connectivity matrices; different curves in the figures show the identification performance obtained from three different datasets (Datasets I–III). C, Effect of parcellation scheme. We calculated the connectivity profiles of the scans based on 360-node and 68-node cortical parcellation maps and compared the identification performance of different parcellation schemes. D, Identification with two-base set including two longitudinal connectivity matrices as the base set or two-target set including two longitudinal connectivity matrices as the target set. The box plots show the performance of identification with the two-base set, two-target set, and single matrix on the three datasets (i.e., MM-Dataset I, MM-Dataset II, and MM-Dataset III) generated from 57 subjects with >2 longitudinal scans. The error bar is the SD of identification rates.