
Figure 6.
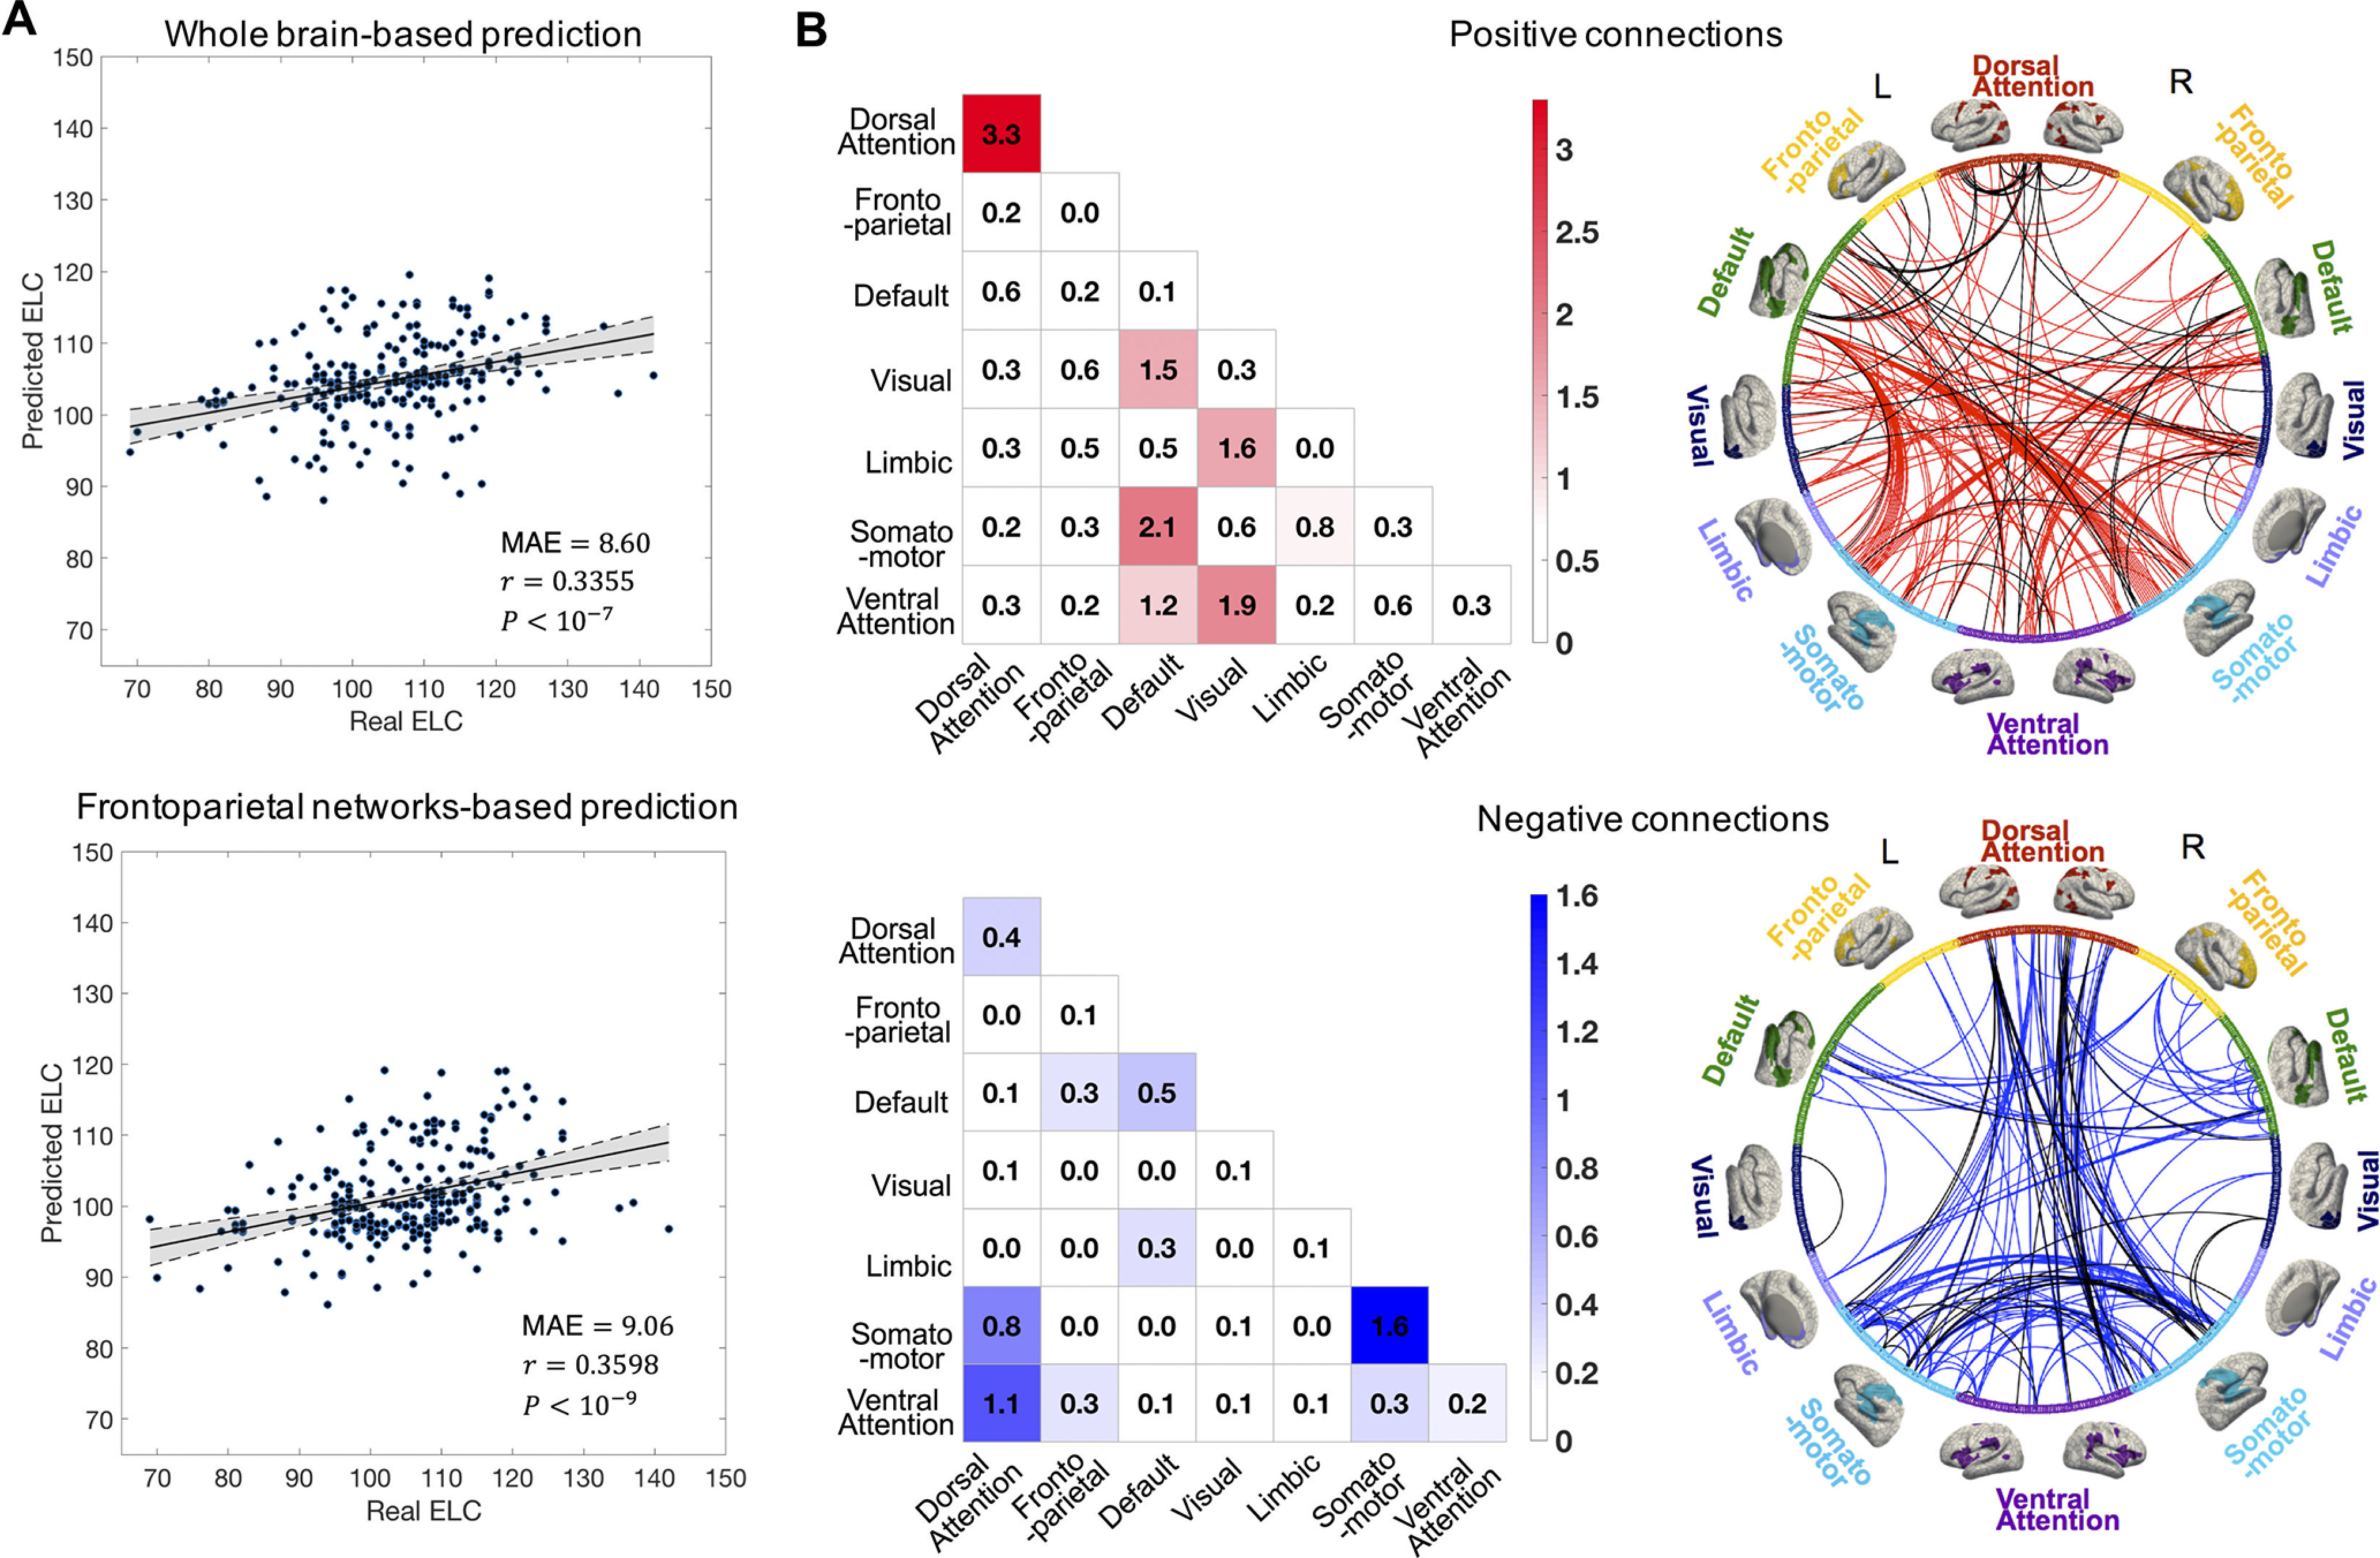
Cognitive score prediction based on functional connectome. A, ELC score prediction results based on the whole-brain connectivity and frontoparietal networks. Scatter plot shows the averaged predicted ELC from the 20 times 10-fold cross-validation and the real observed ELC. Each dot represents the predicted and real ELC pair from one subject; the gray area indicates 95% confidence interval for the best-fit line. B, The contributive edges for ELC score prediction. The contribution of the edges was summarized separately with a negatively and positively correlated edge set. The color in the colored matrices shows the summed standardized contribution of within and between networks. The circle map shows the contribution of the edges to the ELC score prediction, where the whole edge set was thresholded at the 99.9th percentile for better visualization; the 602 parcels in the whole brain are grouped into seven networks. The black lines in the circle map represent the most contributive edges for both cognitive prediction and infant identification.