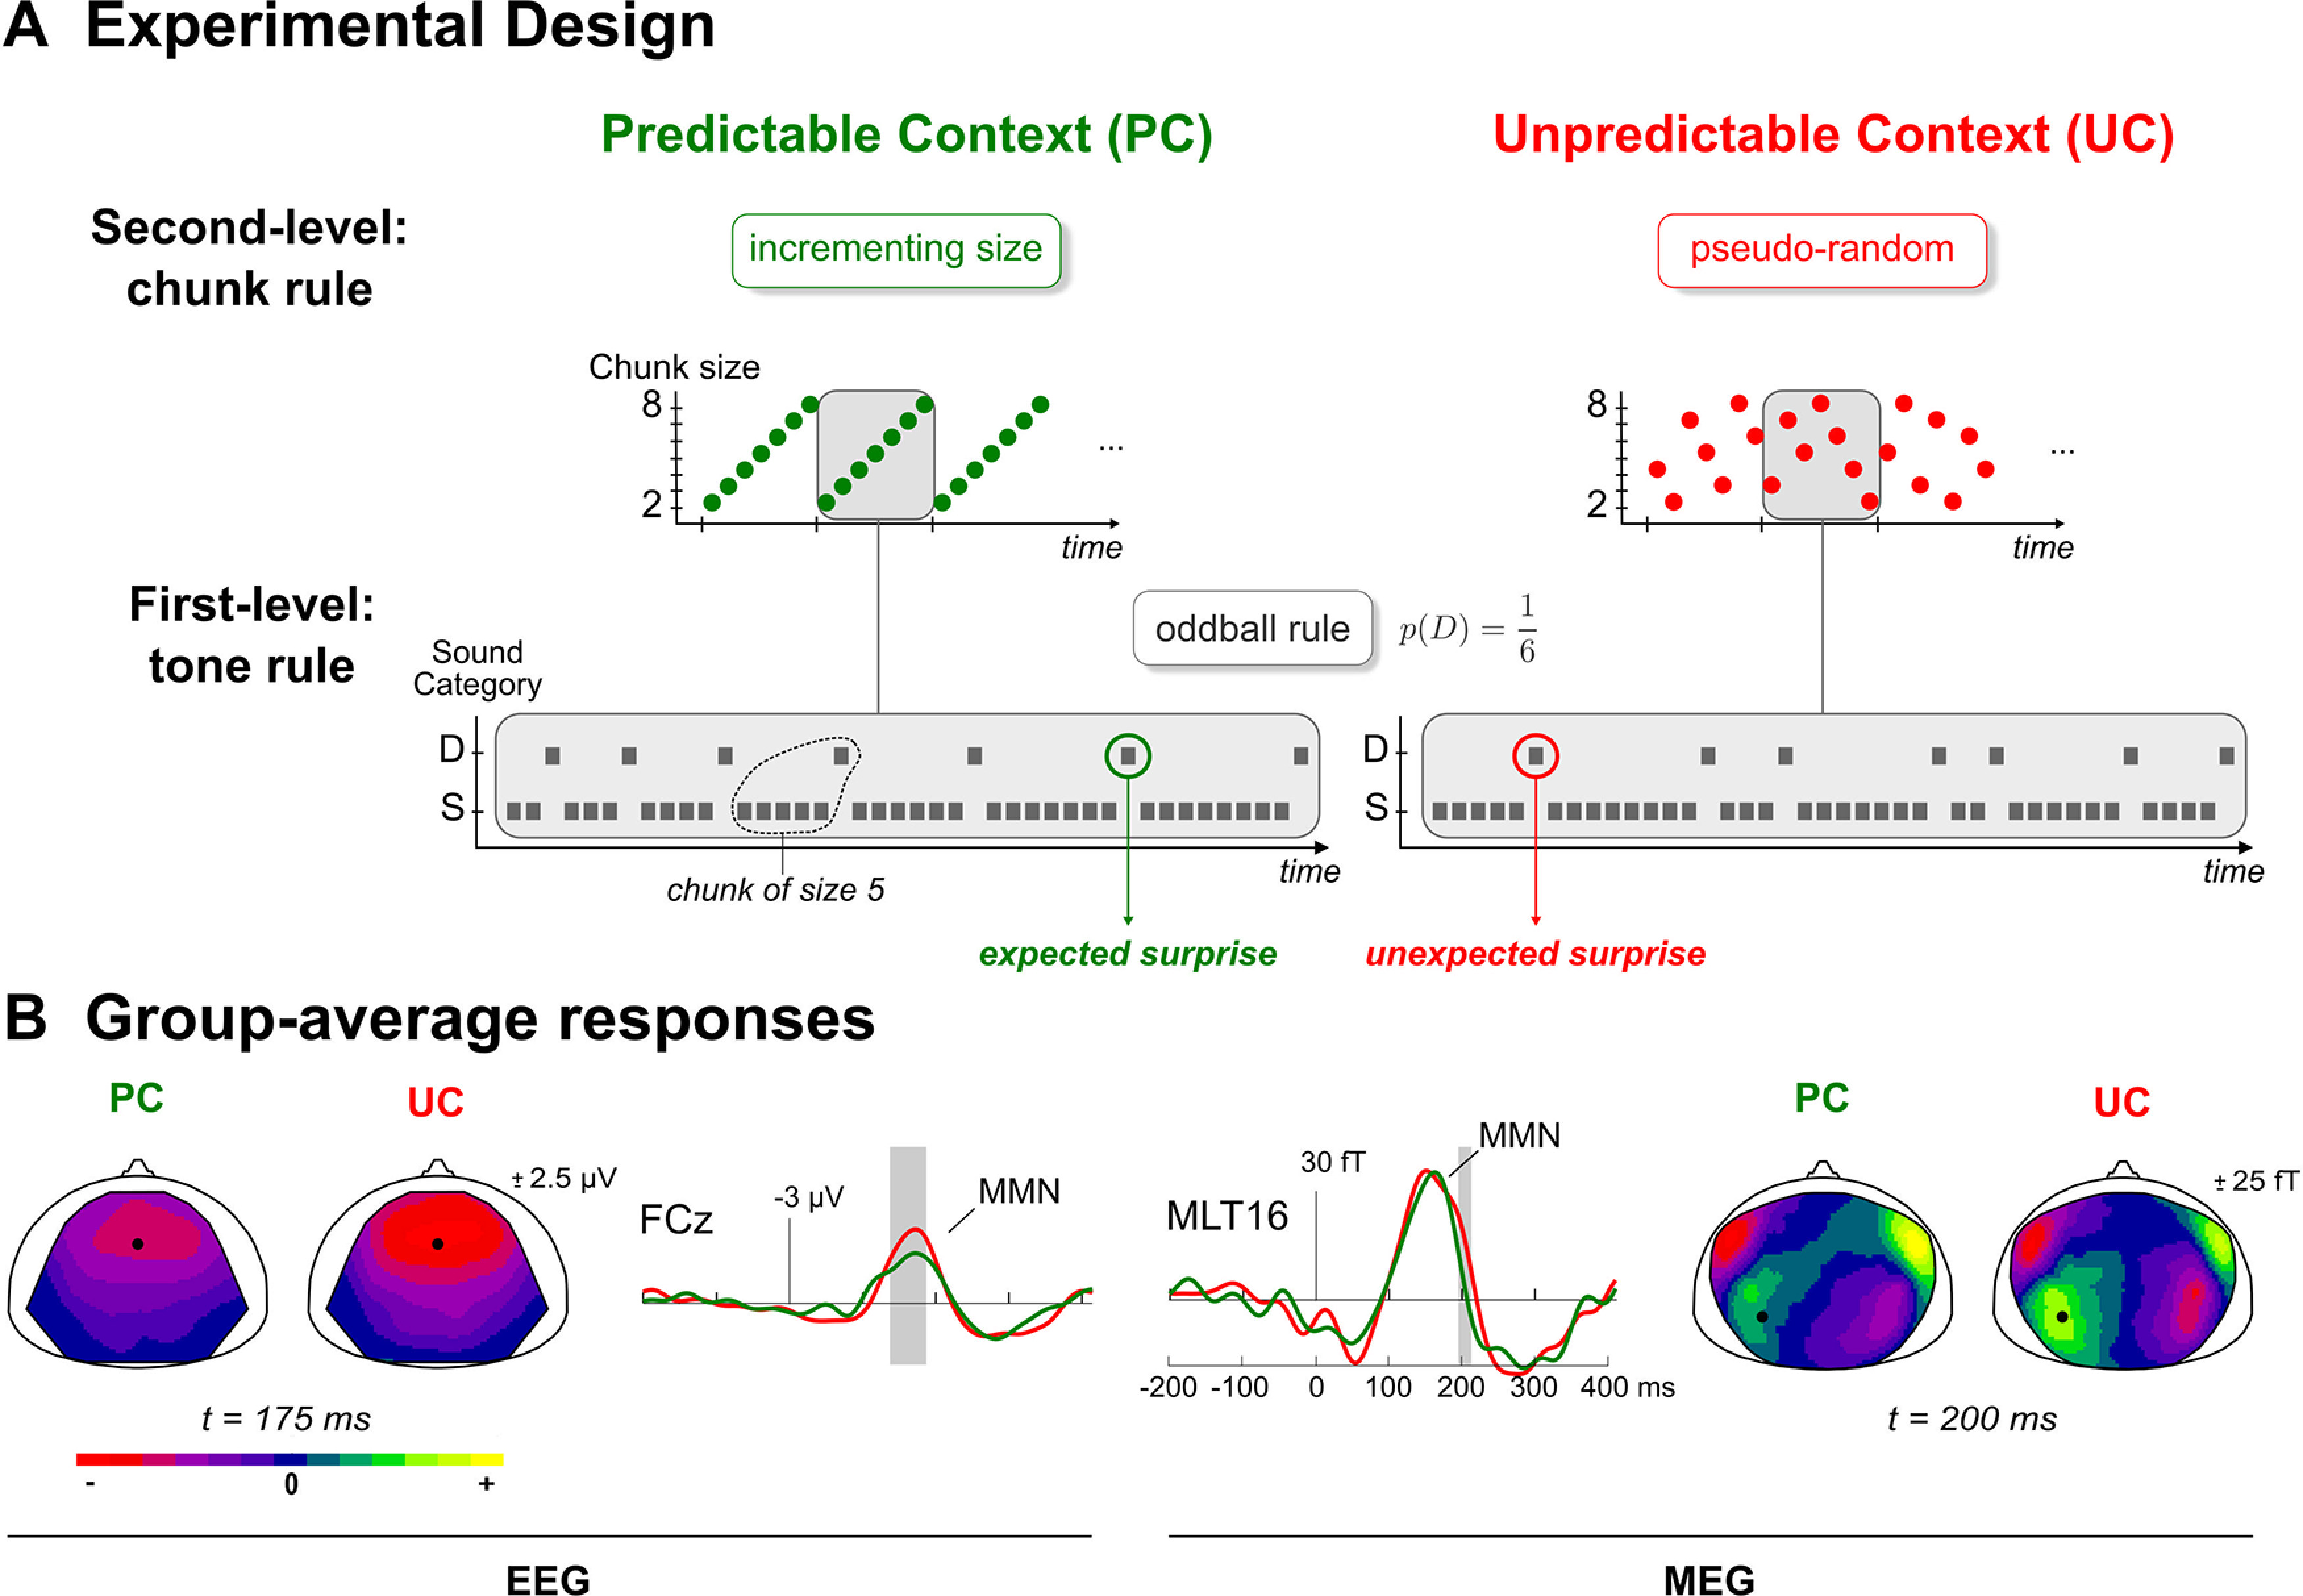
Figure 1.

A, Experimental design. Schematic view of the predictability manipulation applying to typical oddball sound sequences. PC (left, green) involves cycles of ordered transitions between segments of repeating standards (chunks), which become shuffled in the UC (right, red). Deviant probability remains the same in both context (p = 1/6). Gray rectangles delineate an exemplary cycle for both sequences. S: Standard, D: Deviant. B, Group-average difference responses. For each modality (EEG, left; MEG, right), scalp maps of grand-average difference (deviant – standard) responses at latency showing a significant predictability effect for both contexts (PC: green; UC: red). Middle plots: traces at sensors showing a significant MMN reduction under predictability (EEG: FCz; MEG: MLT16; location on related scalp map is represented by a black circle); gray areas indicate the significant time intervals for these sensors (permutation tests with multiple comparison correction, p < 0.05).
