Figure 3.
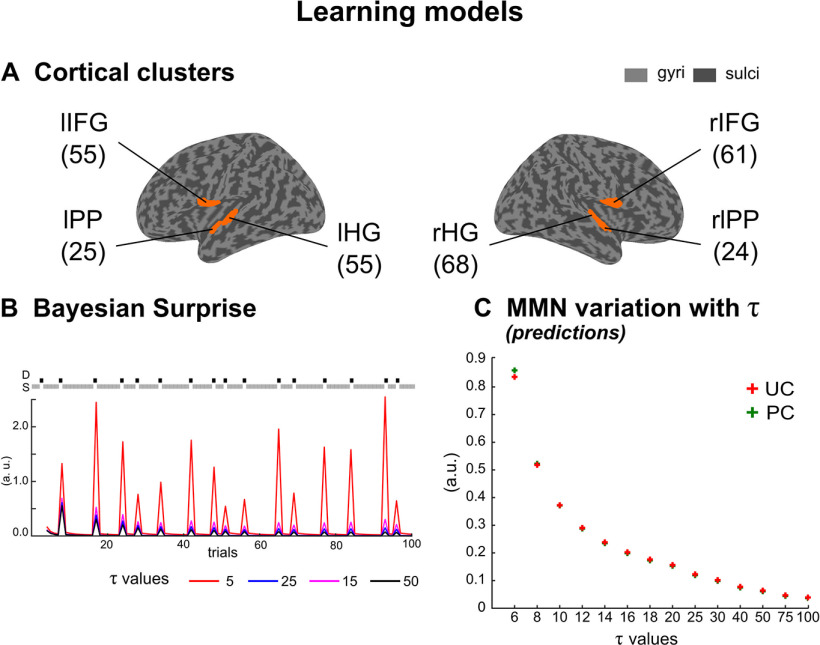
Perceptual learning models. A, Each cluster of interest is represented (orange) over the inflated cortical surface of the SPM template brain (Mattout et al., 2007). These six clusters are left, right HG (lHG, rHG), left, right PP (lPP, rPP) and left, right IFG (lIFG, rIFG). Total number of nodes in each cluster is indicated in parenthesis. B, Bayesian surprise as a function of (arbitrary units, a.u.). Illustration of different BS trajectories obtained with varying , for the first 100 stimuli of a typical UC oddball sequence. Two comments should be made: (1) BS decreases as increases and (2) whatever , BS is larger for deviants (D, black squares) than for standards (S, gray squares). C, Learning model predictions of the MMN amplitude as a function of (group average) for UC (red) and PC (green) sound sequences (see Materials and Methods). Note that in both contexts, MMN amplitude decreases similarly as increases.

