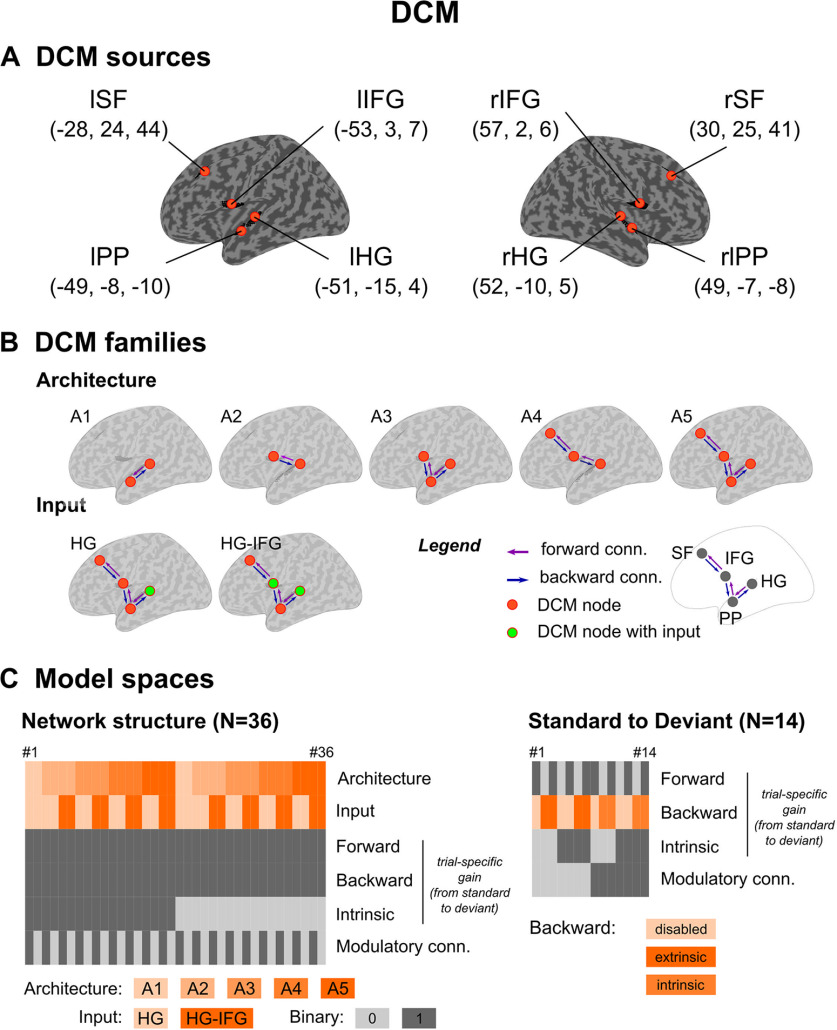
Figure 4.
DCM. A, Cortical sources for DCM analysis. Each source is indicated schematically with orange dots on the inflated cortex, with corresponding MNI coordinates (mm) in parenthesis. B, Model families. Upper row, Schematic view of the five model families designed to test DCM architecture in deviance processing. Bottom row, The two model families of DCM input, HG and HG-IFG. Color codes of extrinsic connections (conn.) and DCM source (or node) are provided in the legend. C, Model spaces. Network structure analysis (left): DCM specifications for each of the 36 models (in columns). Frontal, backward and intrinsic trial-specific gains, as well as modulatory connections correspond to binary options (enabled = 1, disabled= 0) applying to the entire network. Standard-to-deviant modulation analysis (right), following the same logic of display. Backward trial-specific gains were disabled or applied onto either extrinsic or intrinsic connections depending on modulatory connections (as detailed in the main text).

