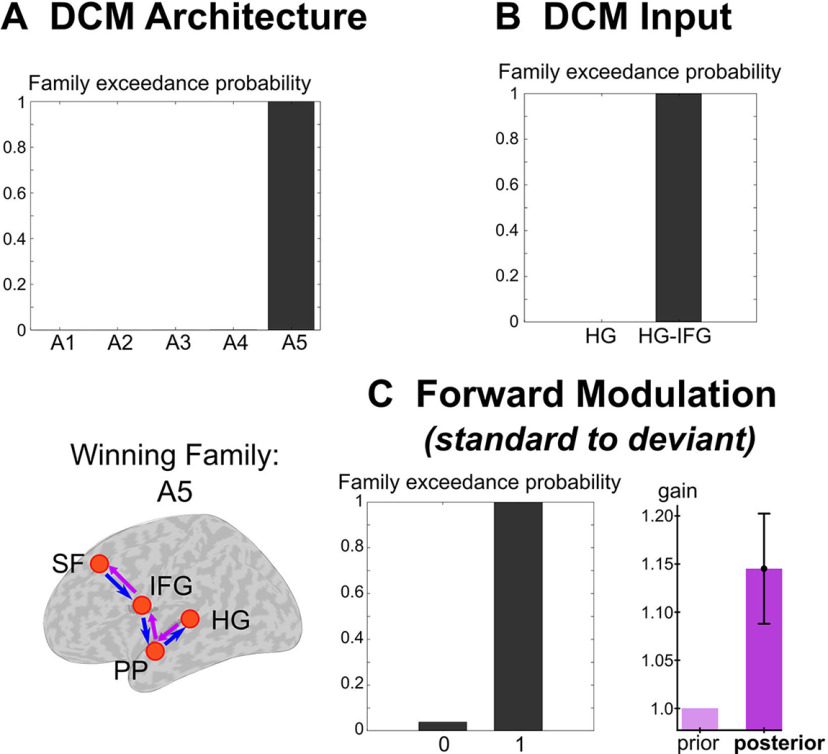
Figure 6.
DCM of deviance processing, using p-MEEG. A, Family inference for DCM architecture: family exceedance probabilities (upper left) and corresponding network for the winning family A5 (lower left). B, Family inference for DCM inputs. C, Family inference for standard-to-deviant trial-specific modulation for the forward connectivity. Family exceedance probabilities of the model families with disabled (0) and enabled modulation (1) is provided (left) and group-level BMA estimates of gain values (in condition UC) averaged over the DCM network is represented (right). Prior value of gain (light purple) was set to 1 assuming no standard-to-deviant modulation. Labels for the cortical sources and model families are provided in the main text.

