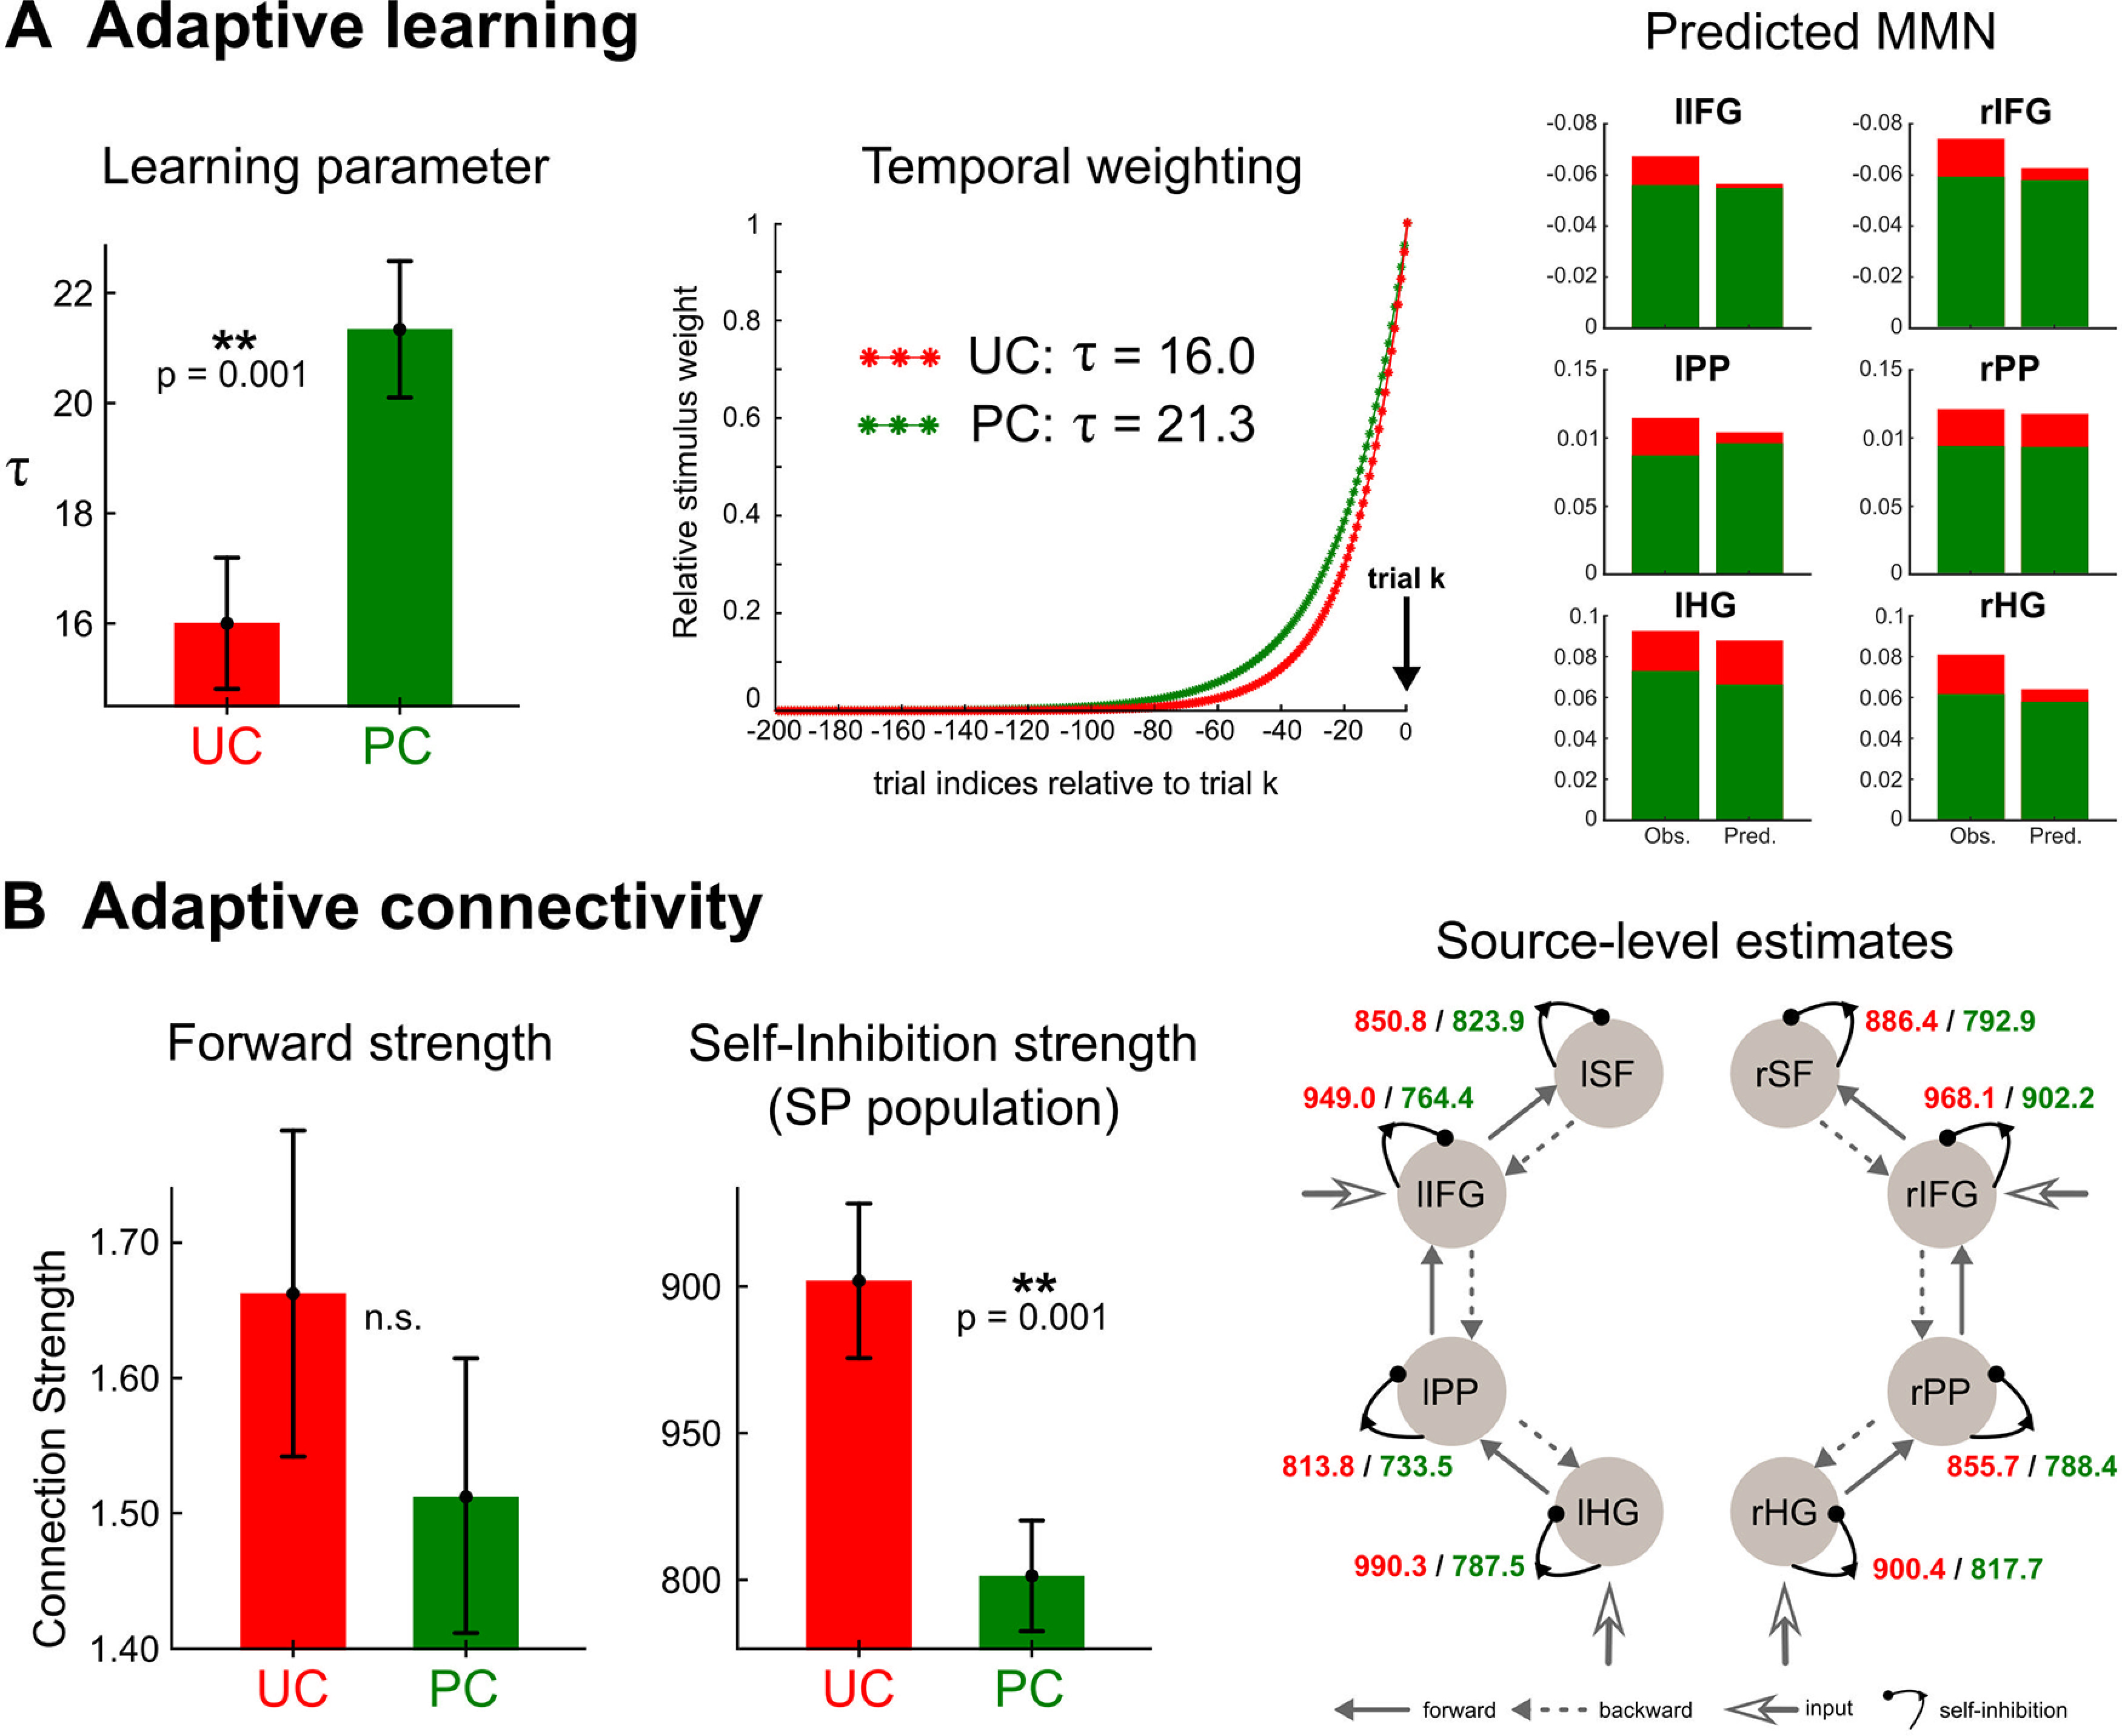
Figure 7.

Effect of predictability on auditory processing. A, Cognitive modeling (perceptual learning). Left plot, Effect of predictability on learning parameter . Posterior estimates of averaged at the group level and over the six clusters exhibited a significant difference between conditions. Middle plot, Downweighting of past observations obtained with the posterior estimates of for conditions UC (red) and PC (green), respectively. Right plot, Group-level observed (Obs.) and predicted (Pred.) MMN amplitude within each cluster, and for condition UC (red) and PC (green). Each value gathers time samples that exhibited a significant learning effect in the first-level analysis and was computed following the scheme described for the pseudo-MMN computation (detailed in the main text). B, Physiologic counterpart (DCM). Effect of predictability onto effective connectivity obtained with the fusion of EEG and MEG DCMs. Left and middle plots, Posterior estimates of forward and self-inhibition strengths measured in both conditions (UC: red, PC: green), averaged over the group and over the connections within the DCM. SP: superficial pyramidal; a.u.: arbitrary units. Right plot, Source-based self-inhibition strengths showing a significant predictability effect. Values for each condition (UC: red, PC: green) are displayed over a typical DCM graph representation. Labels of cortical sources as in Figure 4.
