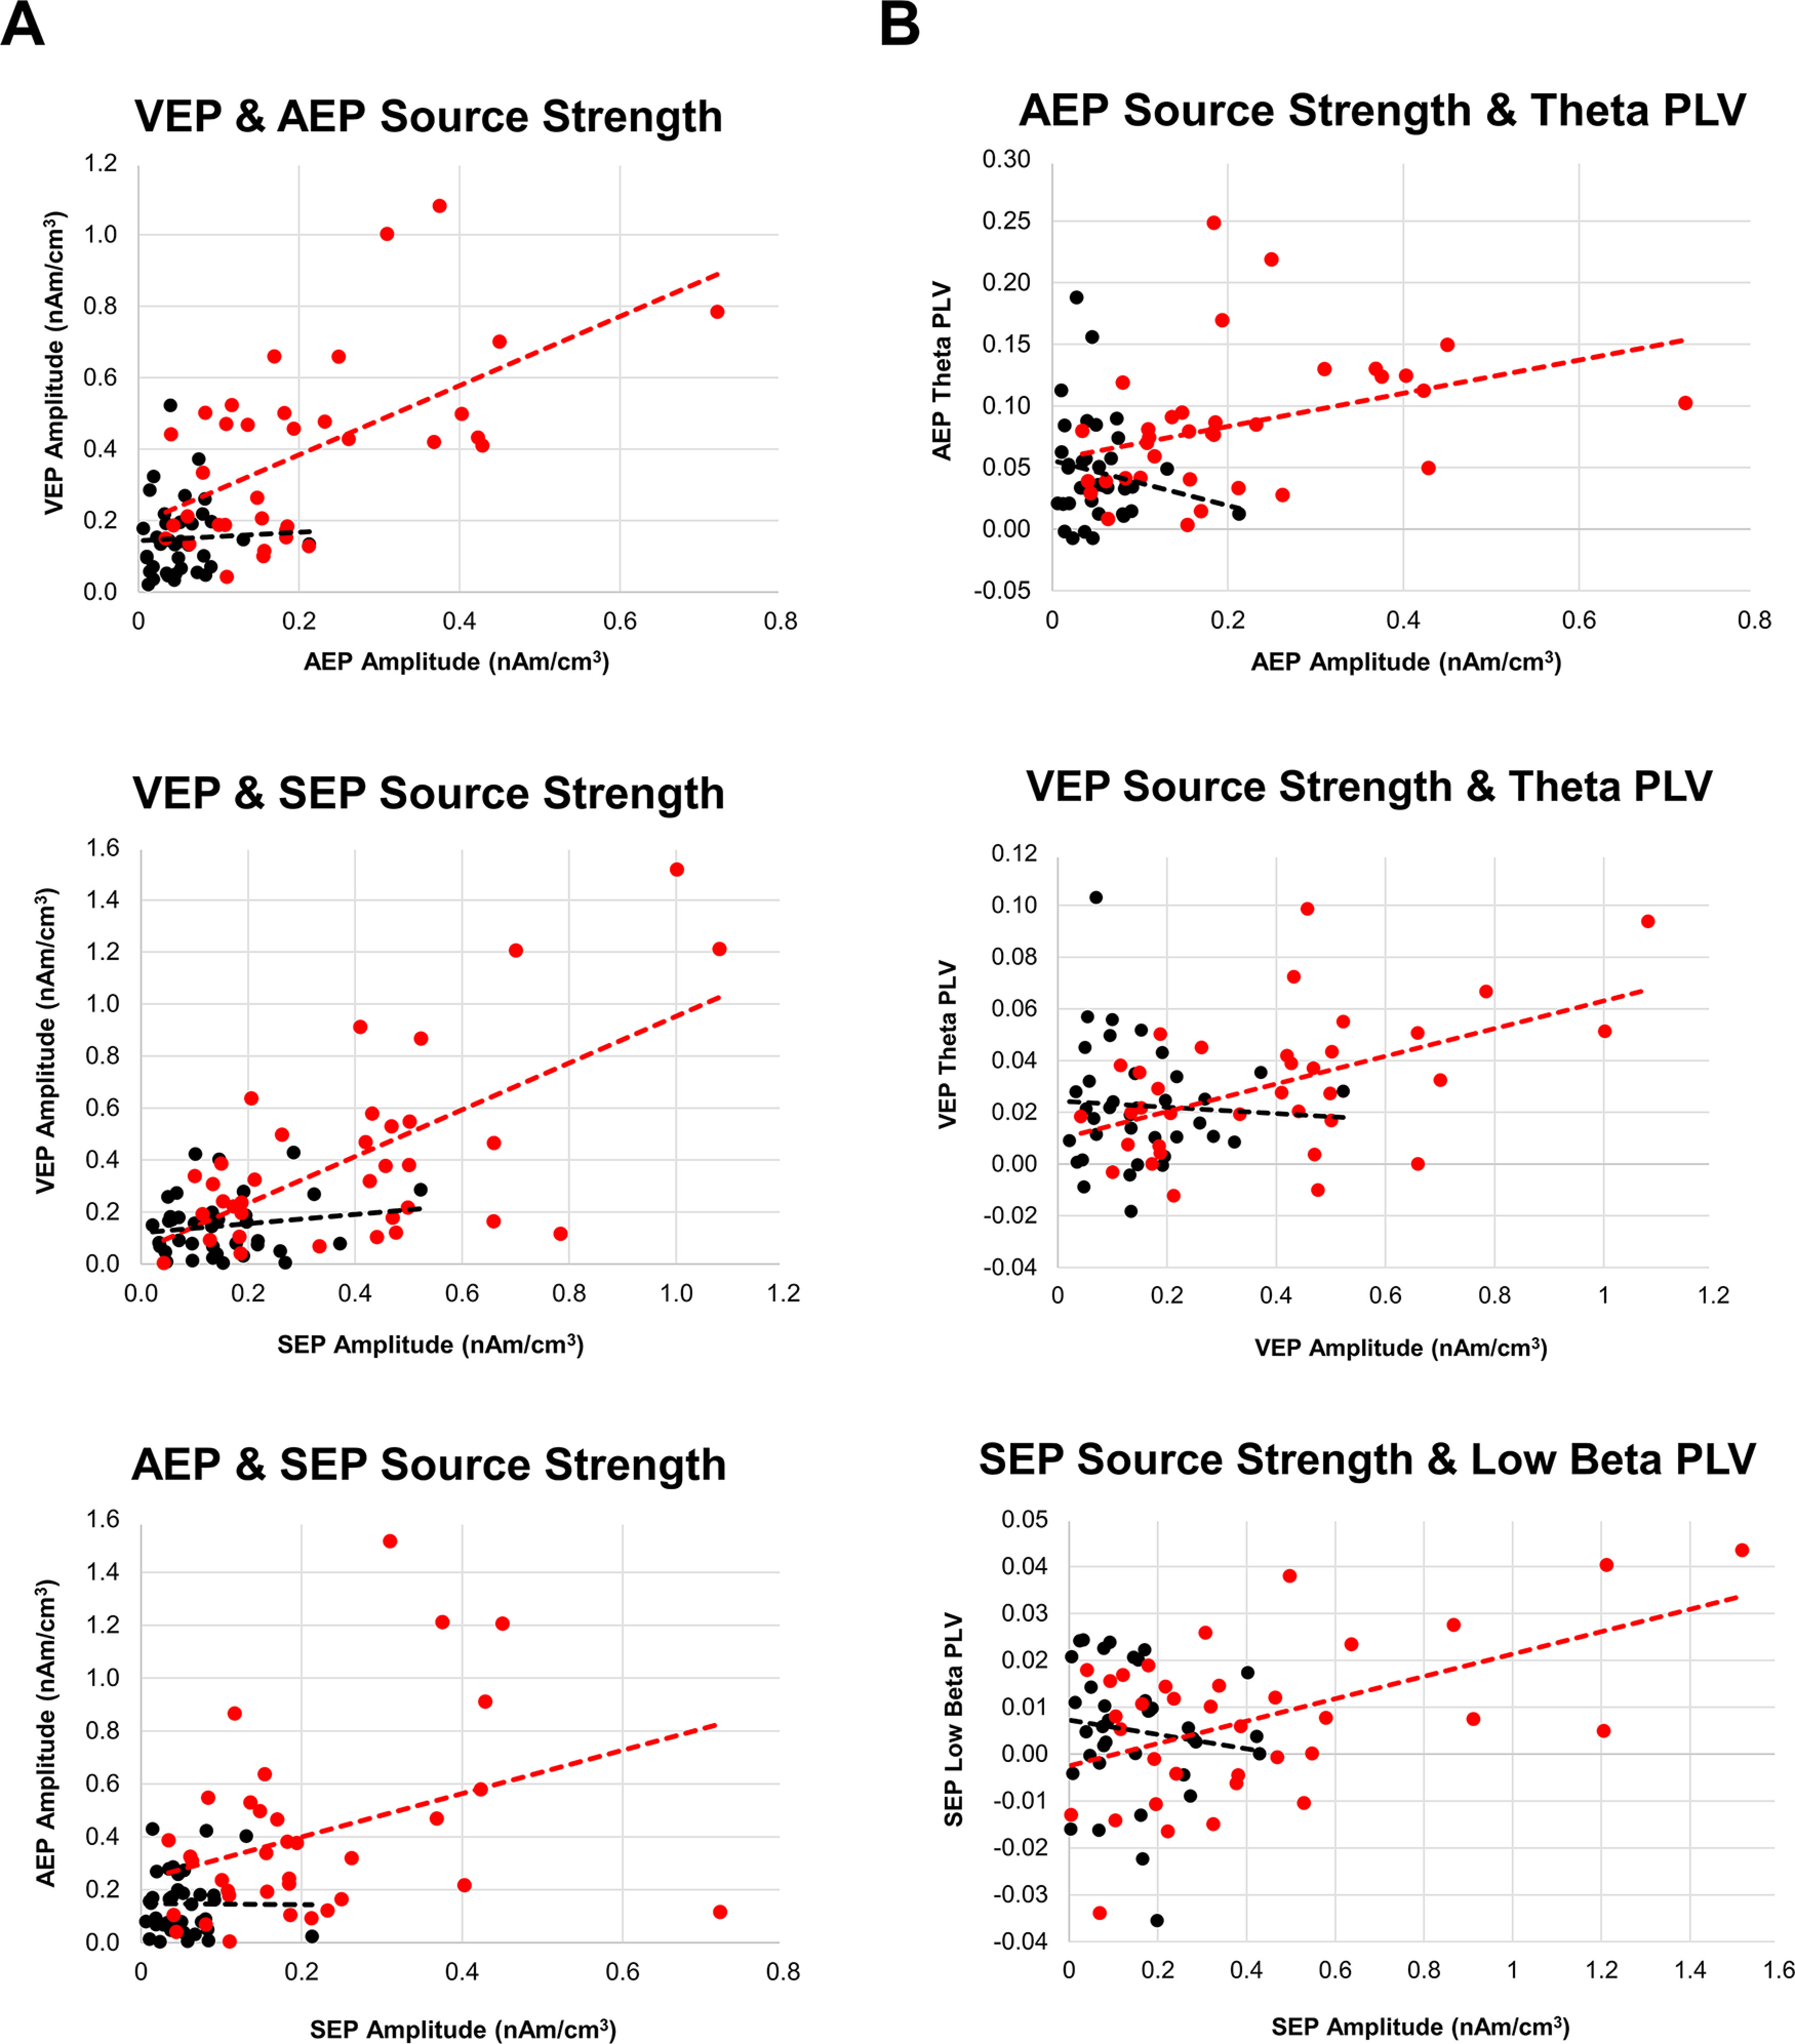
Figure 4.

A, Scatterplots showing the relationship between the source strength activity from auditory, visual, and somatosensory cortices. Measures derived from the statistically significant cluster from permutation statistics of CLARA source activity that represented the sensory P1 from each domain: Cluster 3 for AEP, Cluster 7 for VEP, and Cluster 4 for SEP. B, Scatterplots showing the relationship between prefrontal-to-sensory cortex synchrony and source activity. Measures derived from the statistically significant cluster from permutation statistics of CLARA imaging that represented the sensory P1 from each domain: Cluster 3 for AEP, Cluster 7 for VEP, and Cluster 4 for SEP. Some PLV values are negative. This is because of the relative contrast used (stimulus-locked minus non–stimulus-locked epochs) to estimate neural synchrony between brain sources in young and older adults.
