
Figure 2.
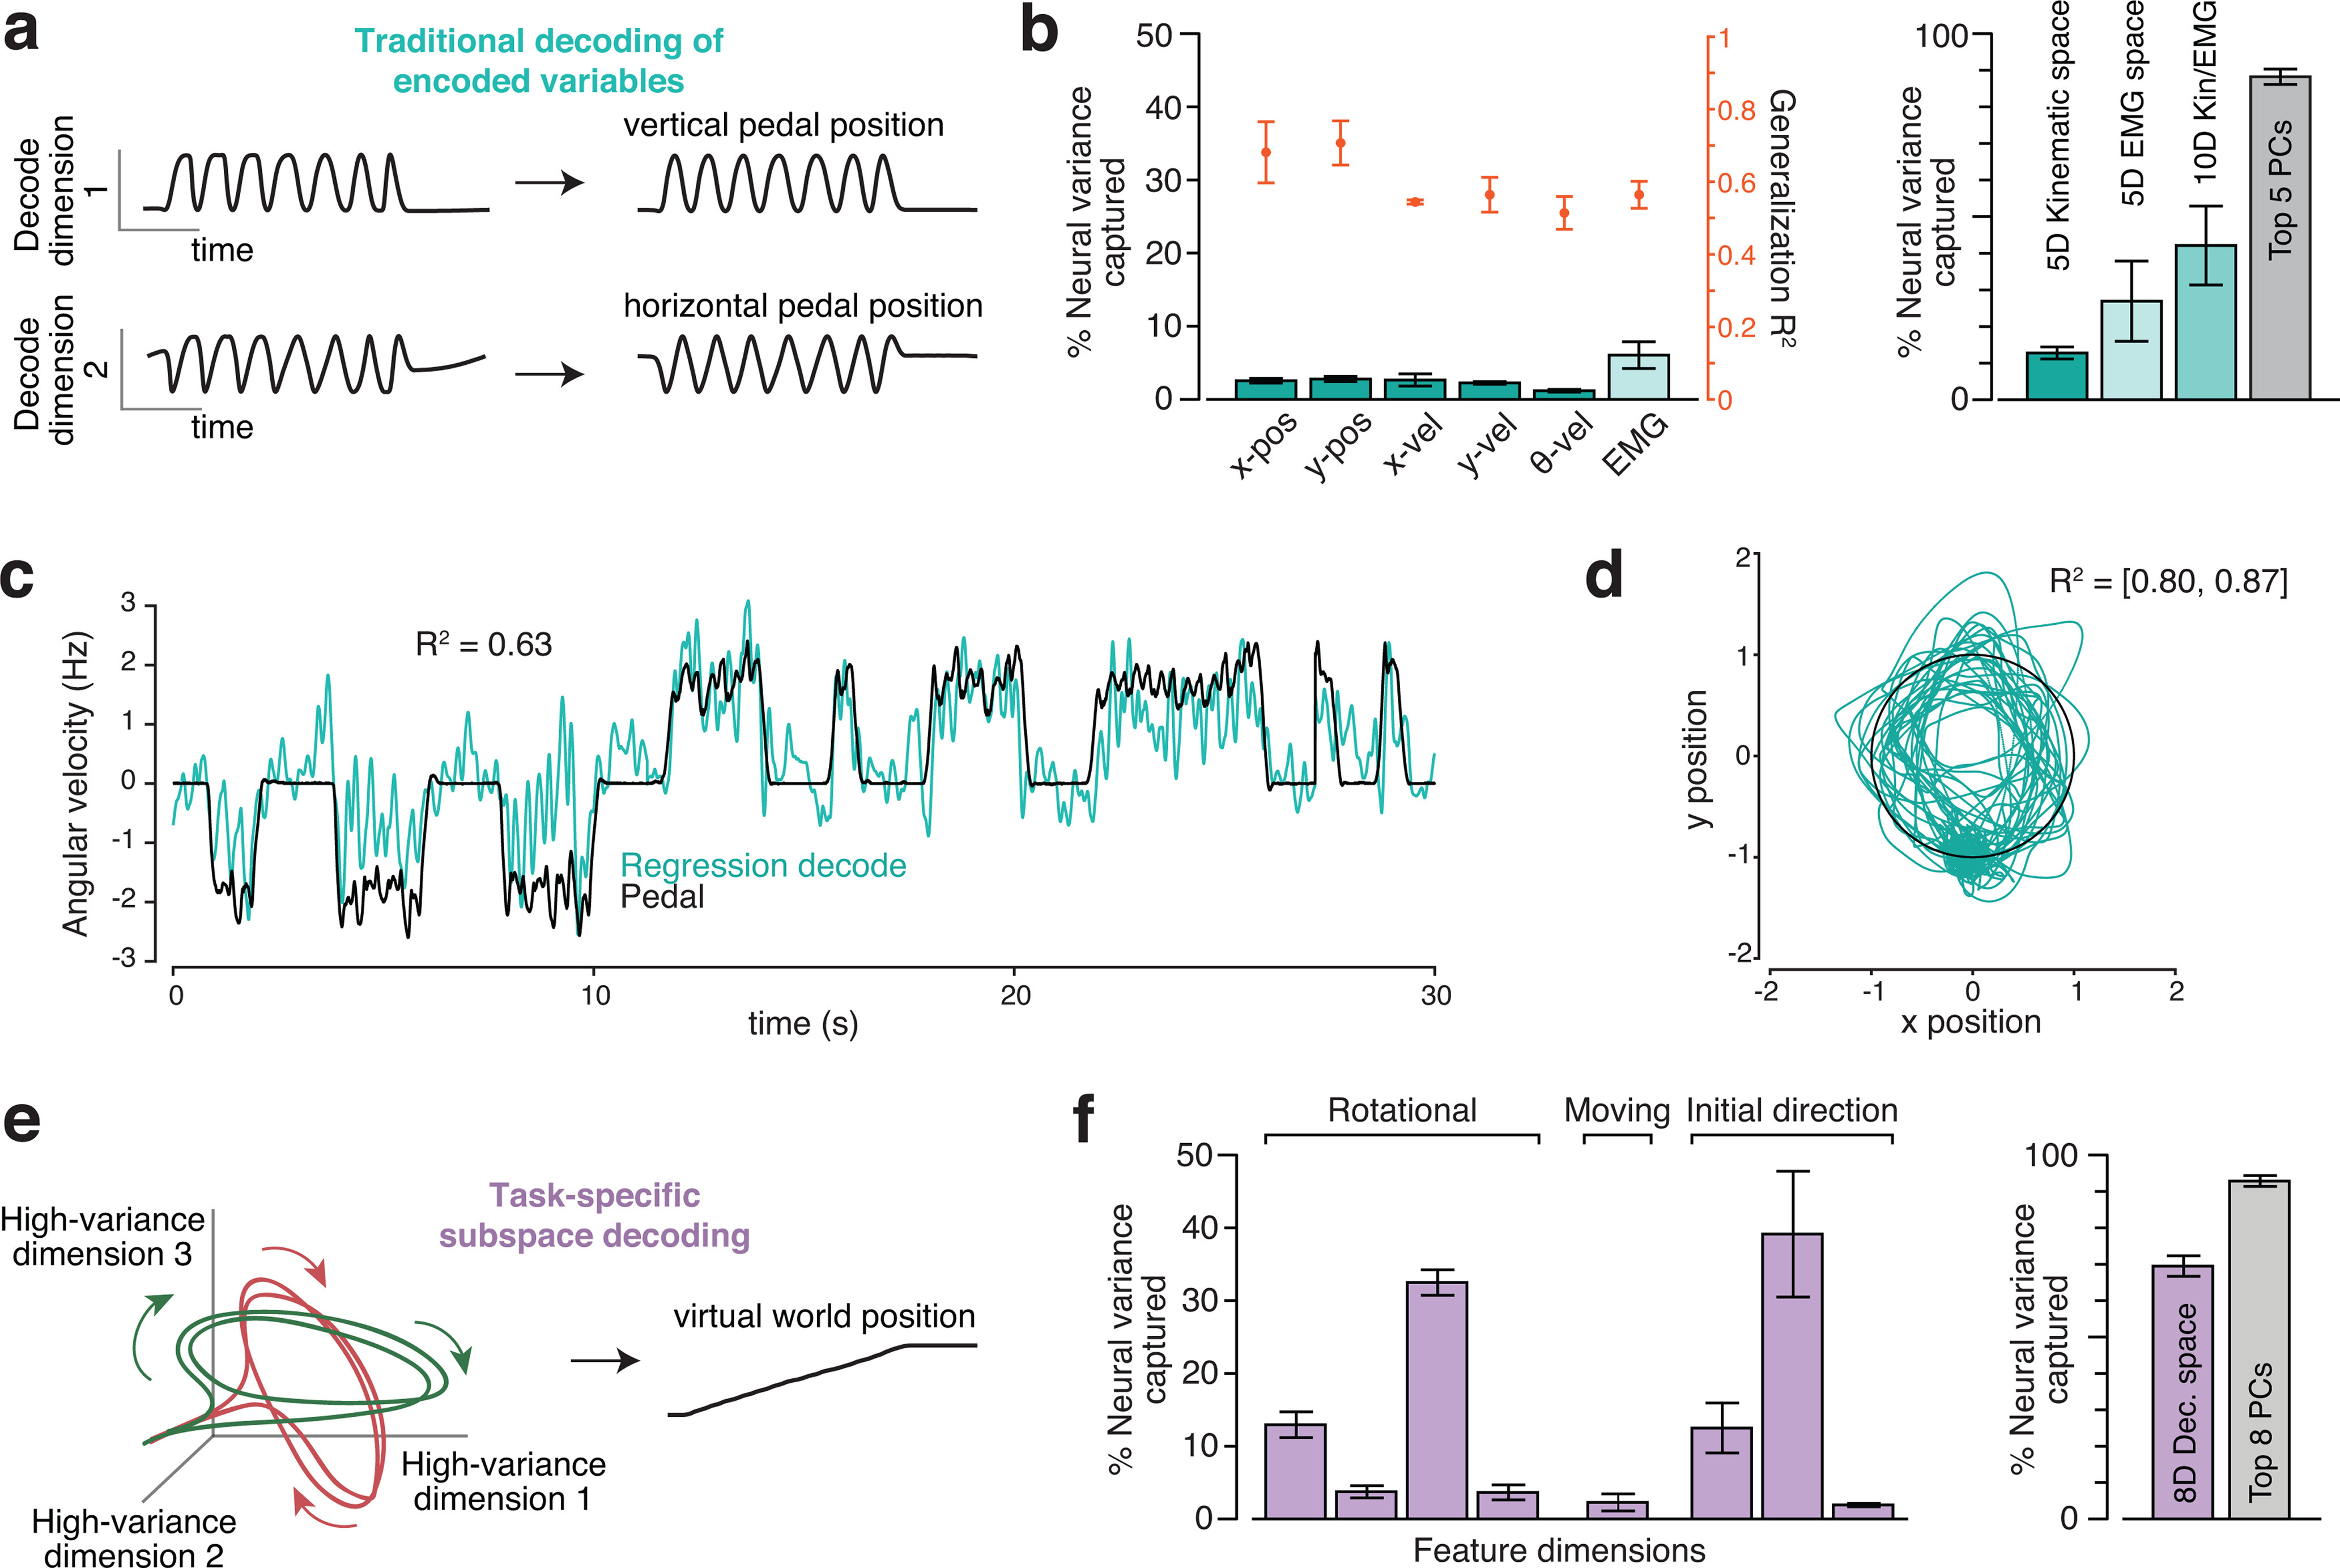
Different decode strategies leverage neural signals with different magnitudes. a, In the traditional decoding strategy, neural firing rates are assumed to predominantly encode the key variables. The encoding model is usually assumed to be roughly linear when variables are expressed appropriately. For example, cosine tuning for reach velocity is equivalent to a linear dependence on horizontal and vertical velocity. The goal of decoding is to invert encoding. Thus, decoding dimensions should capture the dominant signals in the neural data (because those are what is encoded). b, Variance of the neural population response captured by dimensions used to decode kinematic parameters (teal bars) and muscle activity (light teal bar). Variance captured was computed based on trial-averaged firing rates, and thus quantifies to the degree to which each neuron's firing rate (as opposed to its noisy spiking) contains a contribution from the signal captured by each dimension. Left subpanel, Neural variance captured (left axis) for dimensions correlating with kinematic variables (individual variables shown separately) and muscles (average across 19 recordings, SE computed across recordings). Also shown are the associated generalized R2 values (right axis) for each decoder. Right subpanel, Total variance captured by subspaces spanned by kinematic-decoding dimensions, muscle-decoding dimensions, or both. (These are not the sum of the individual variances as dimensions were not always orthogonal.) We had different numbers of EMG recordings per day and thus always selected a subset of 5. Variance captured by the top five principal components is shown for comparison. In both subpanels, data are from three manual-control sessions where units (192 channels per day) and muscles (5-7 channels per day) were recorded simultaneously. Each bar/point with error bars plots the average and SE across sessions. c, Example cross-validated regression performance for offline decoding of angular velocity. R2 is the coefficient of determination for the segment of data shown. d, Example cross-validated regression performance for offline decoding of horizontal and vertical pedal position. R2 is the coefficient of determination for the segment of data shown, same time period as in c. e, A new strategy that can be applied, even if the dominant signals do not have the goal of encoding. This strategy seeks to find neural response features that have a robust relationship with the variable one wishes to decode. That relationship may be complex or even incidental but is useful if it involves high-variance response features. f, Similar plot to b, but for the dimensions on which our decoder was built. Left subpanel, Neural variance captured for each of these eight dimensions. Right subpanel, Neural variance captured by the eight-dimensional subspace spanned by those dimensions. Variance captured by the top eight principal components is shown for comparison.