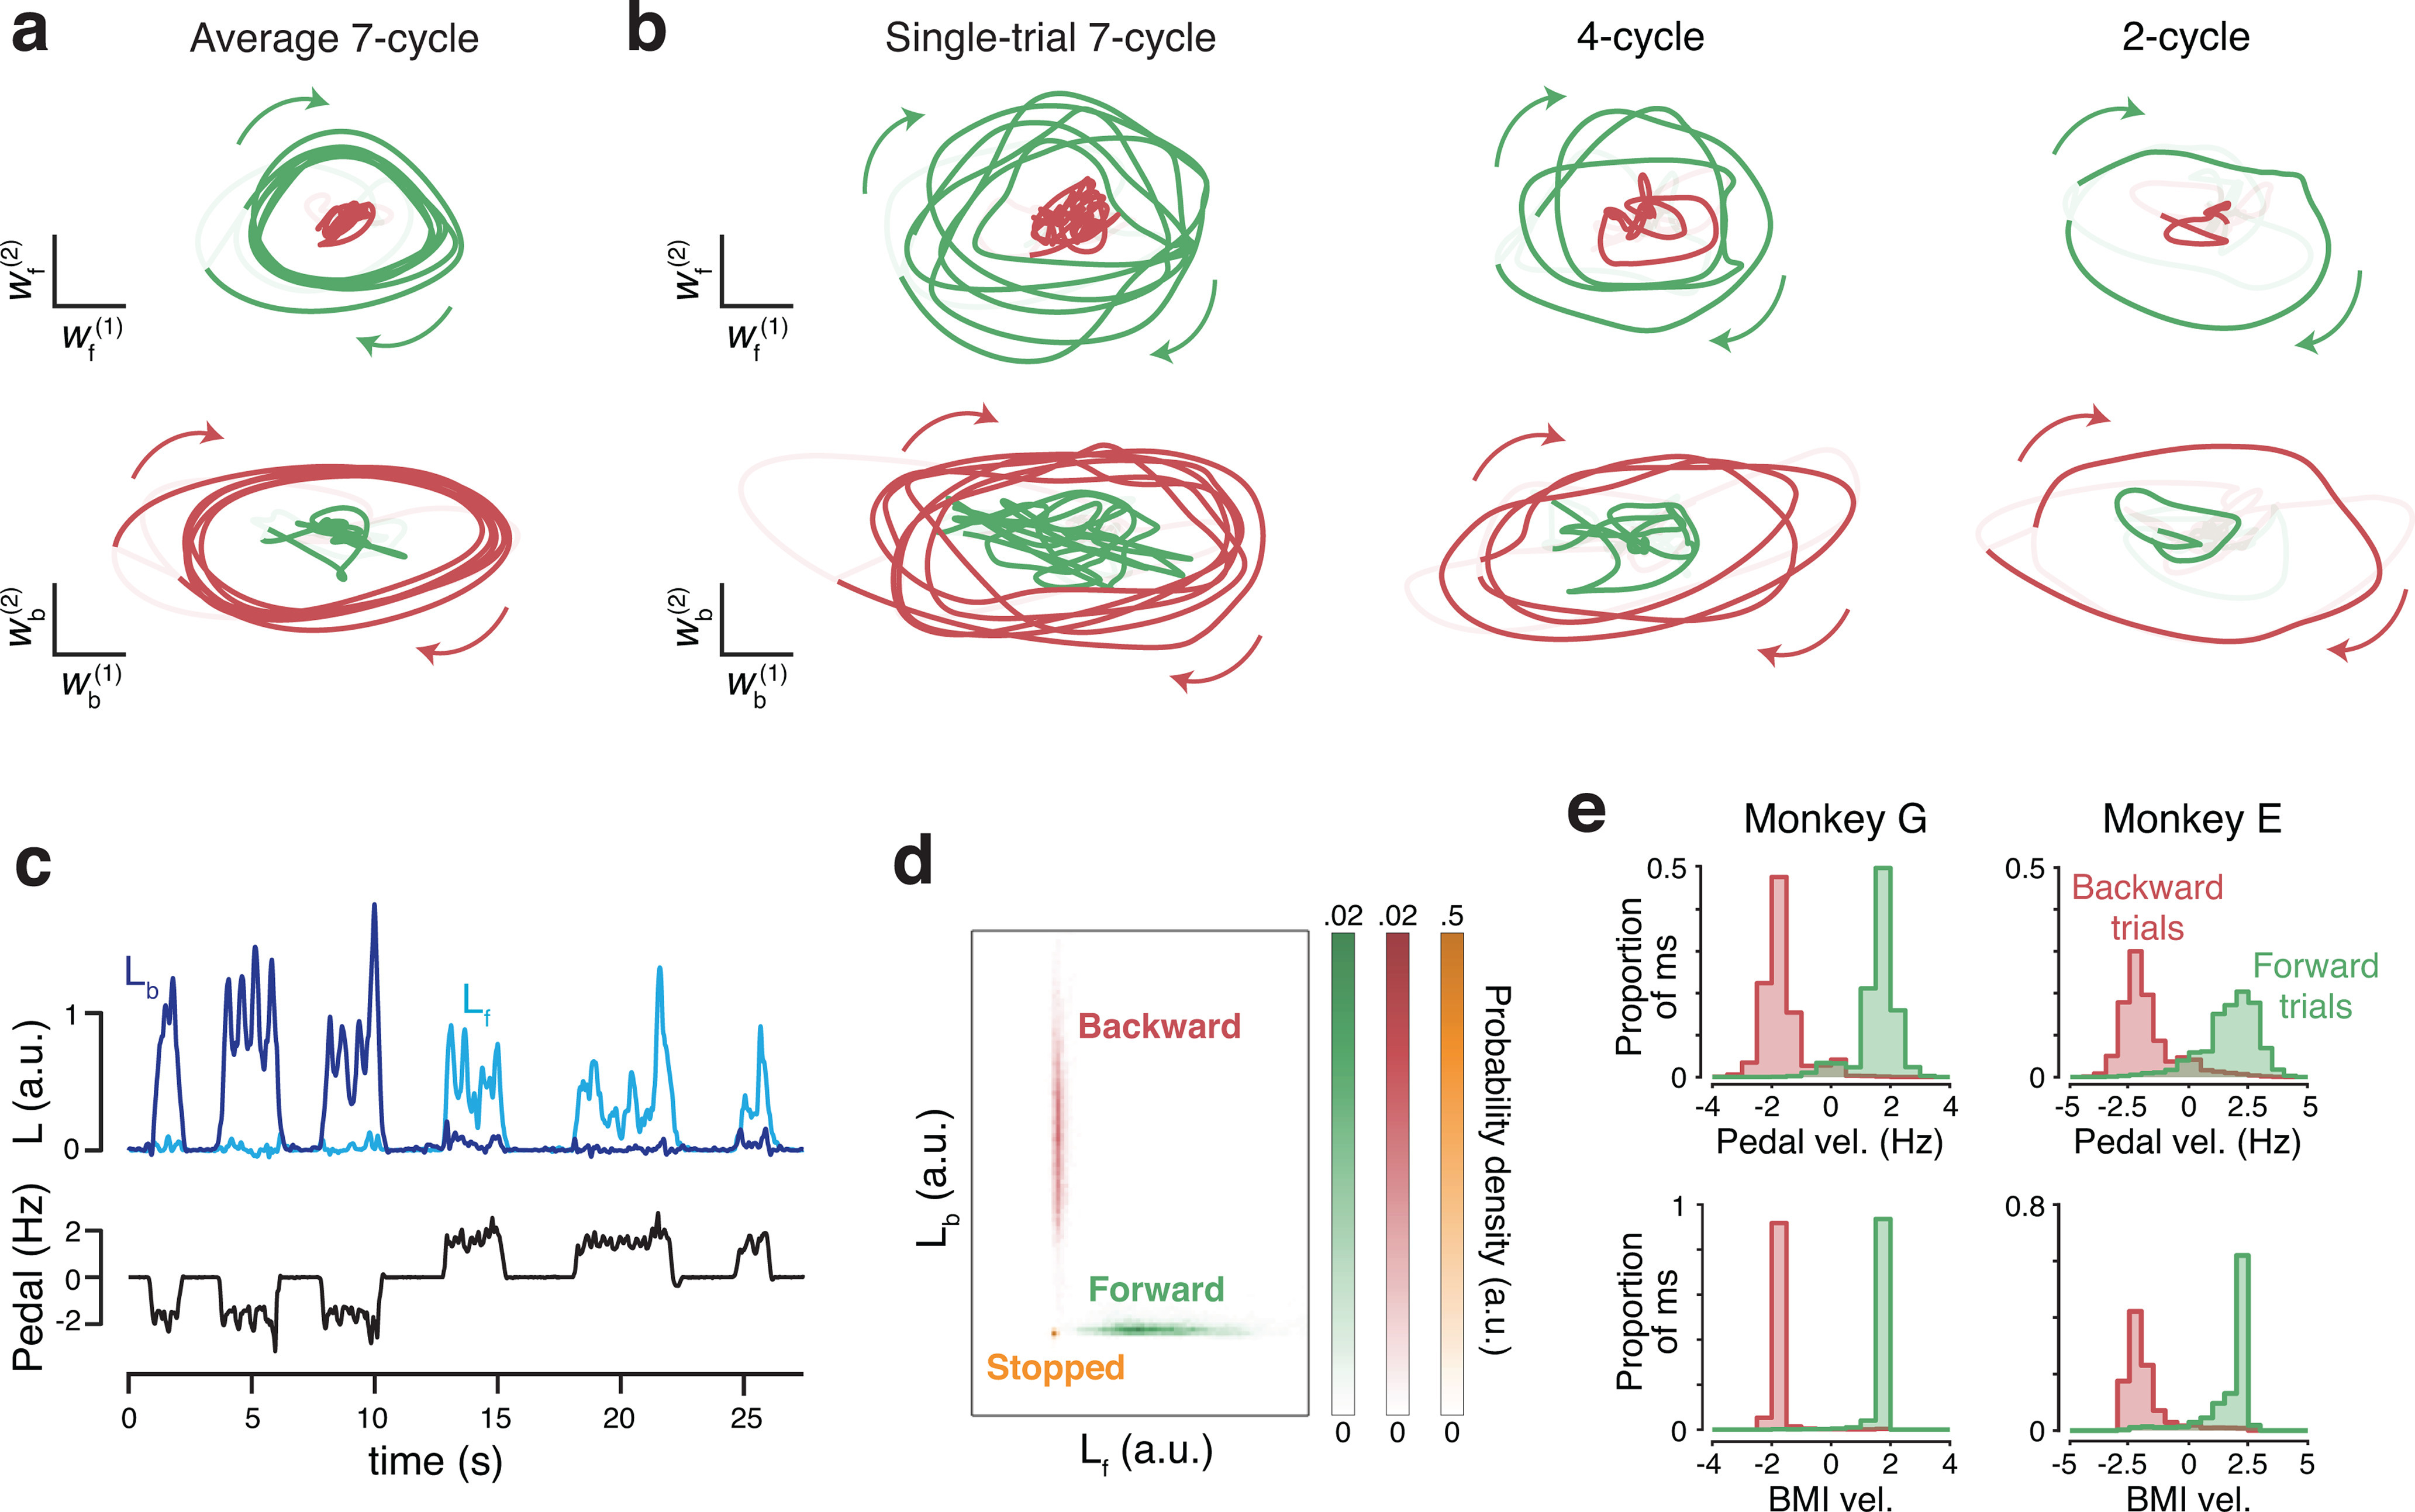
Figure 3.

Leveraging rotational trajectories to decode velocity. a, Trial-averaged population activity, during a manual-control session, projected onto the forward (top) and backward (bottom) rotational planes. Data are from 7 cycle forward (green) and backward (red) conditions. By design, the forward plane primarily captures rotational trajectories during forward cycling, and vice versa. Boldly colored portions of each trace highlight rotations during the middle cycles (a period that excludes the first and last half cycle of each movement). Colored arrows indicate rotation direction. Light portion of each trace corresponds to the rest of the trial. In addition to smoothing with a causal filter, neural data have been high-pass filtered to match what was used during BMI control. Data are from Monkey G. b, As in a, but for six example single trials, one for each of the three distances in the two directions. c, Example angular momentum (L) in the backward plane (dark blue) and forward plane (bright blue) during six trials of BMI control. Black represents velocity of the pedal. Although the pedal was disconnected from the task, this provides a useful indication of how the monkey was intending to move. Data are from the same day shown in a and b. d, Probability densities of angular momentums found from the decoder training trials collected on the same day. e, Histograms of BMI-control velocity (bottom) and (disconnected) pedal velocity (top) for all times the decoder was in the STEADY state (see Materials and Methods), across all BMI-control sessions.
