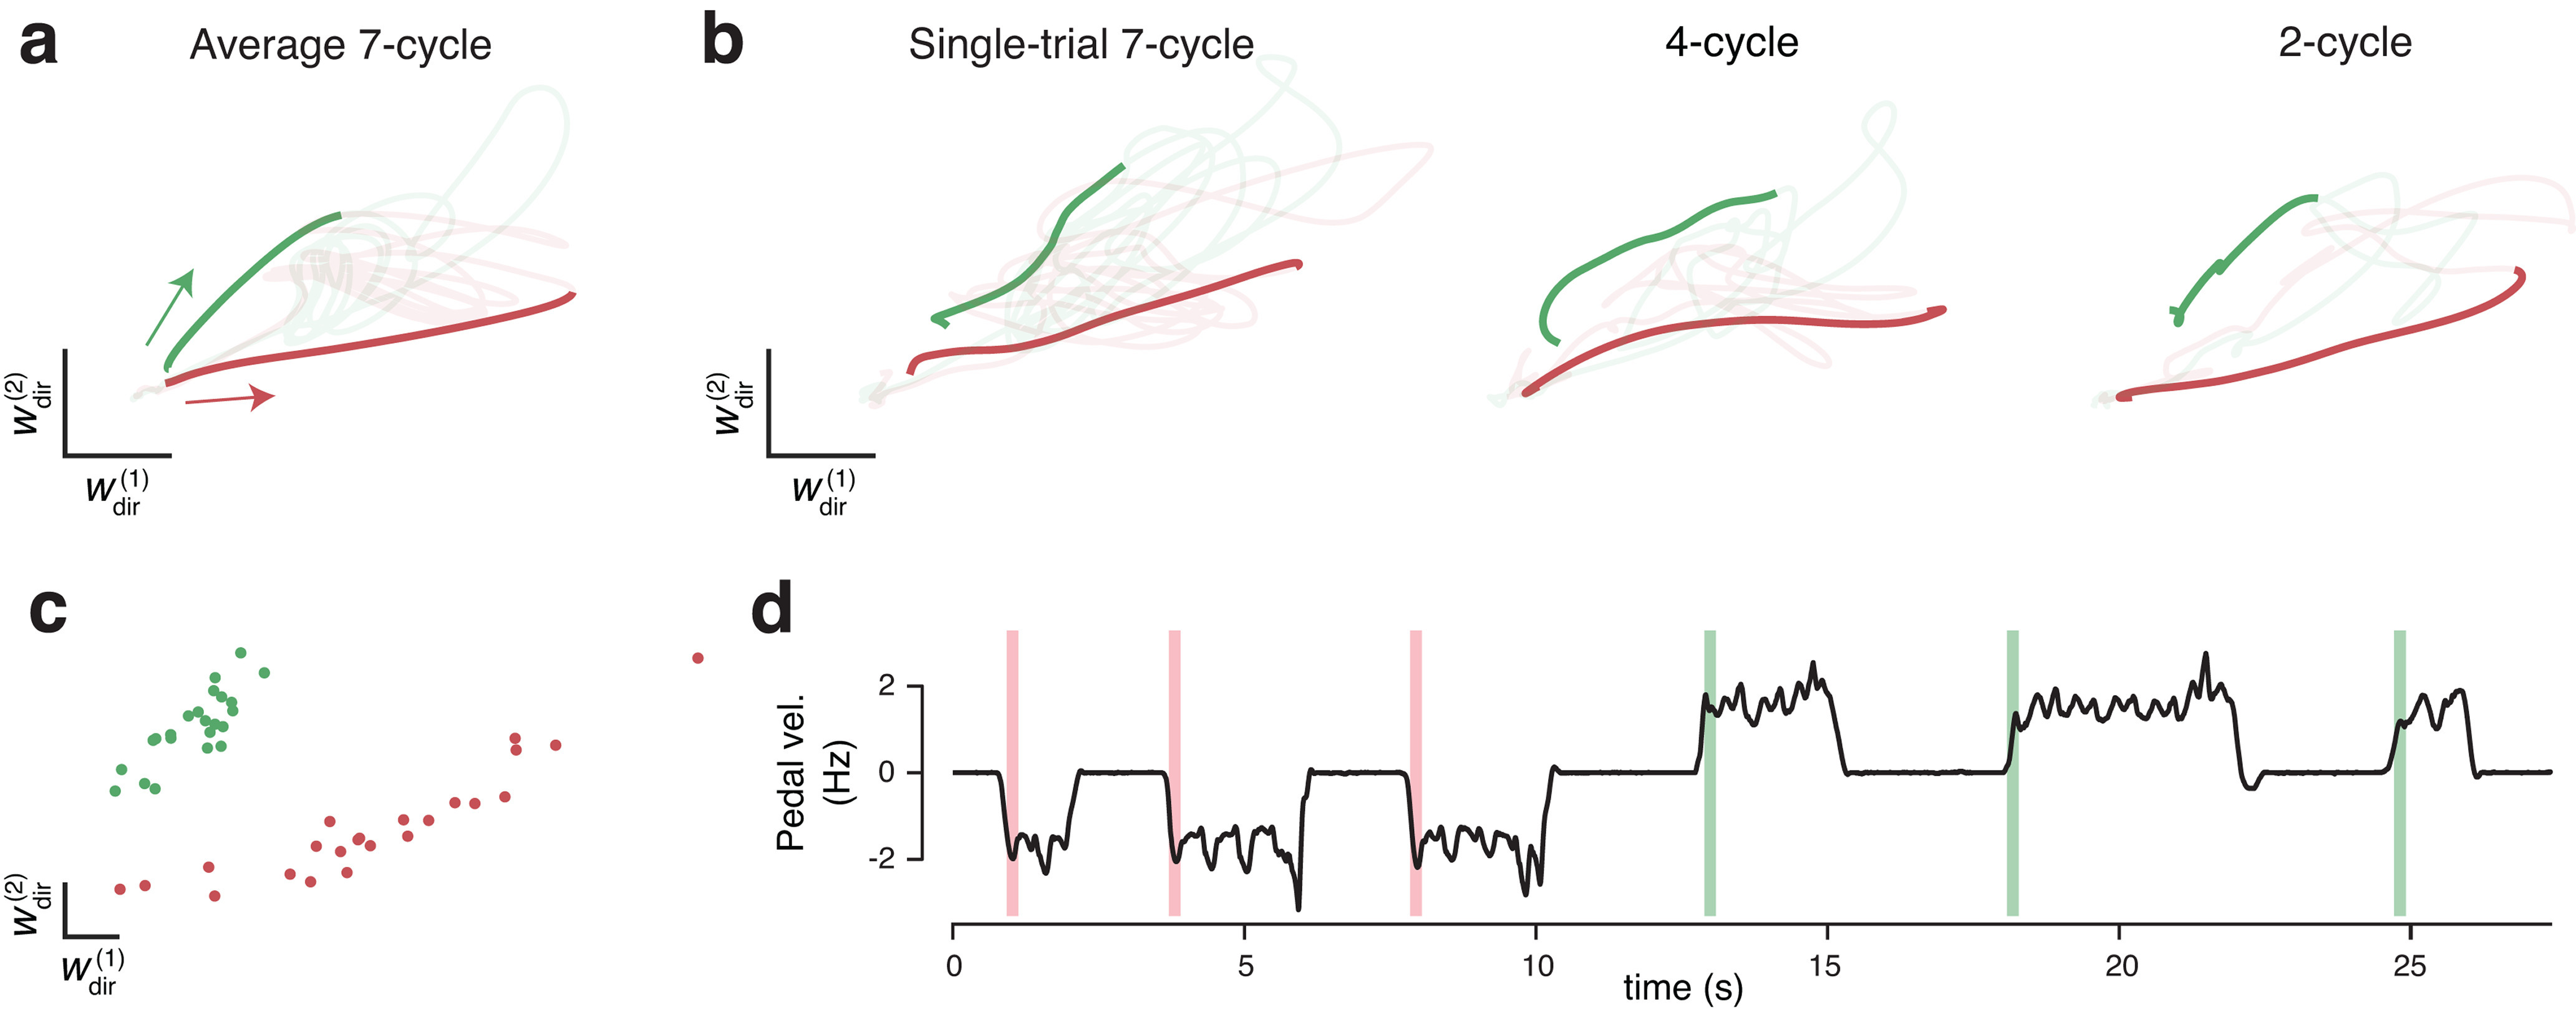
Figure 7.

Leveraging initial-direction dimensions to allow low-latency decoding. a, Trial-averaged population activity, during a manual-control session, projected onto two (of three) initial-direction dimensions (same session and trials as Figs. 3a and 6a). Boldly colored portions of traces highlight −200 to 175 ms relative to physical move onset. Arrows indicate direction of trajectories. b, Same as in a, but for six example single trials (same trials as in Figs. 3b and 6b). c, The location of the neural state, for decoder training data, at the time the state machine (applied post hoc to that training data) entered the EARLY state. These data (50 total trials) were used to fit two Gaussian distributions. During BMI control, when the EARLY state was entered, virtual direction was determined by which distribution maximized the data likelihood. d, Example of initial-direction decoding during BMI control. Colored windows represent the times in the EARLY state, with red and green representing decoded direction. Same example data as in Figures 3c and 6d.
