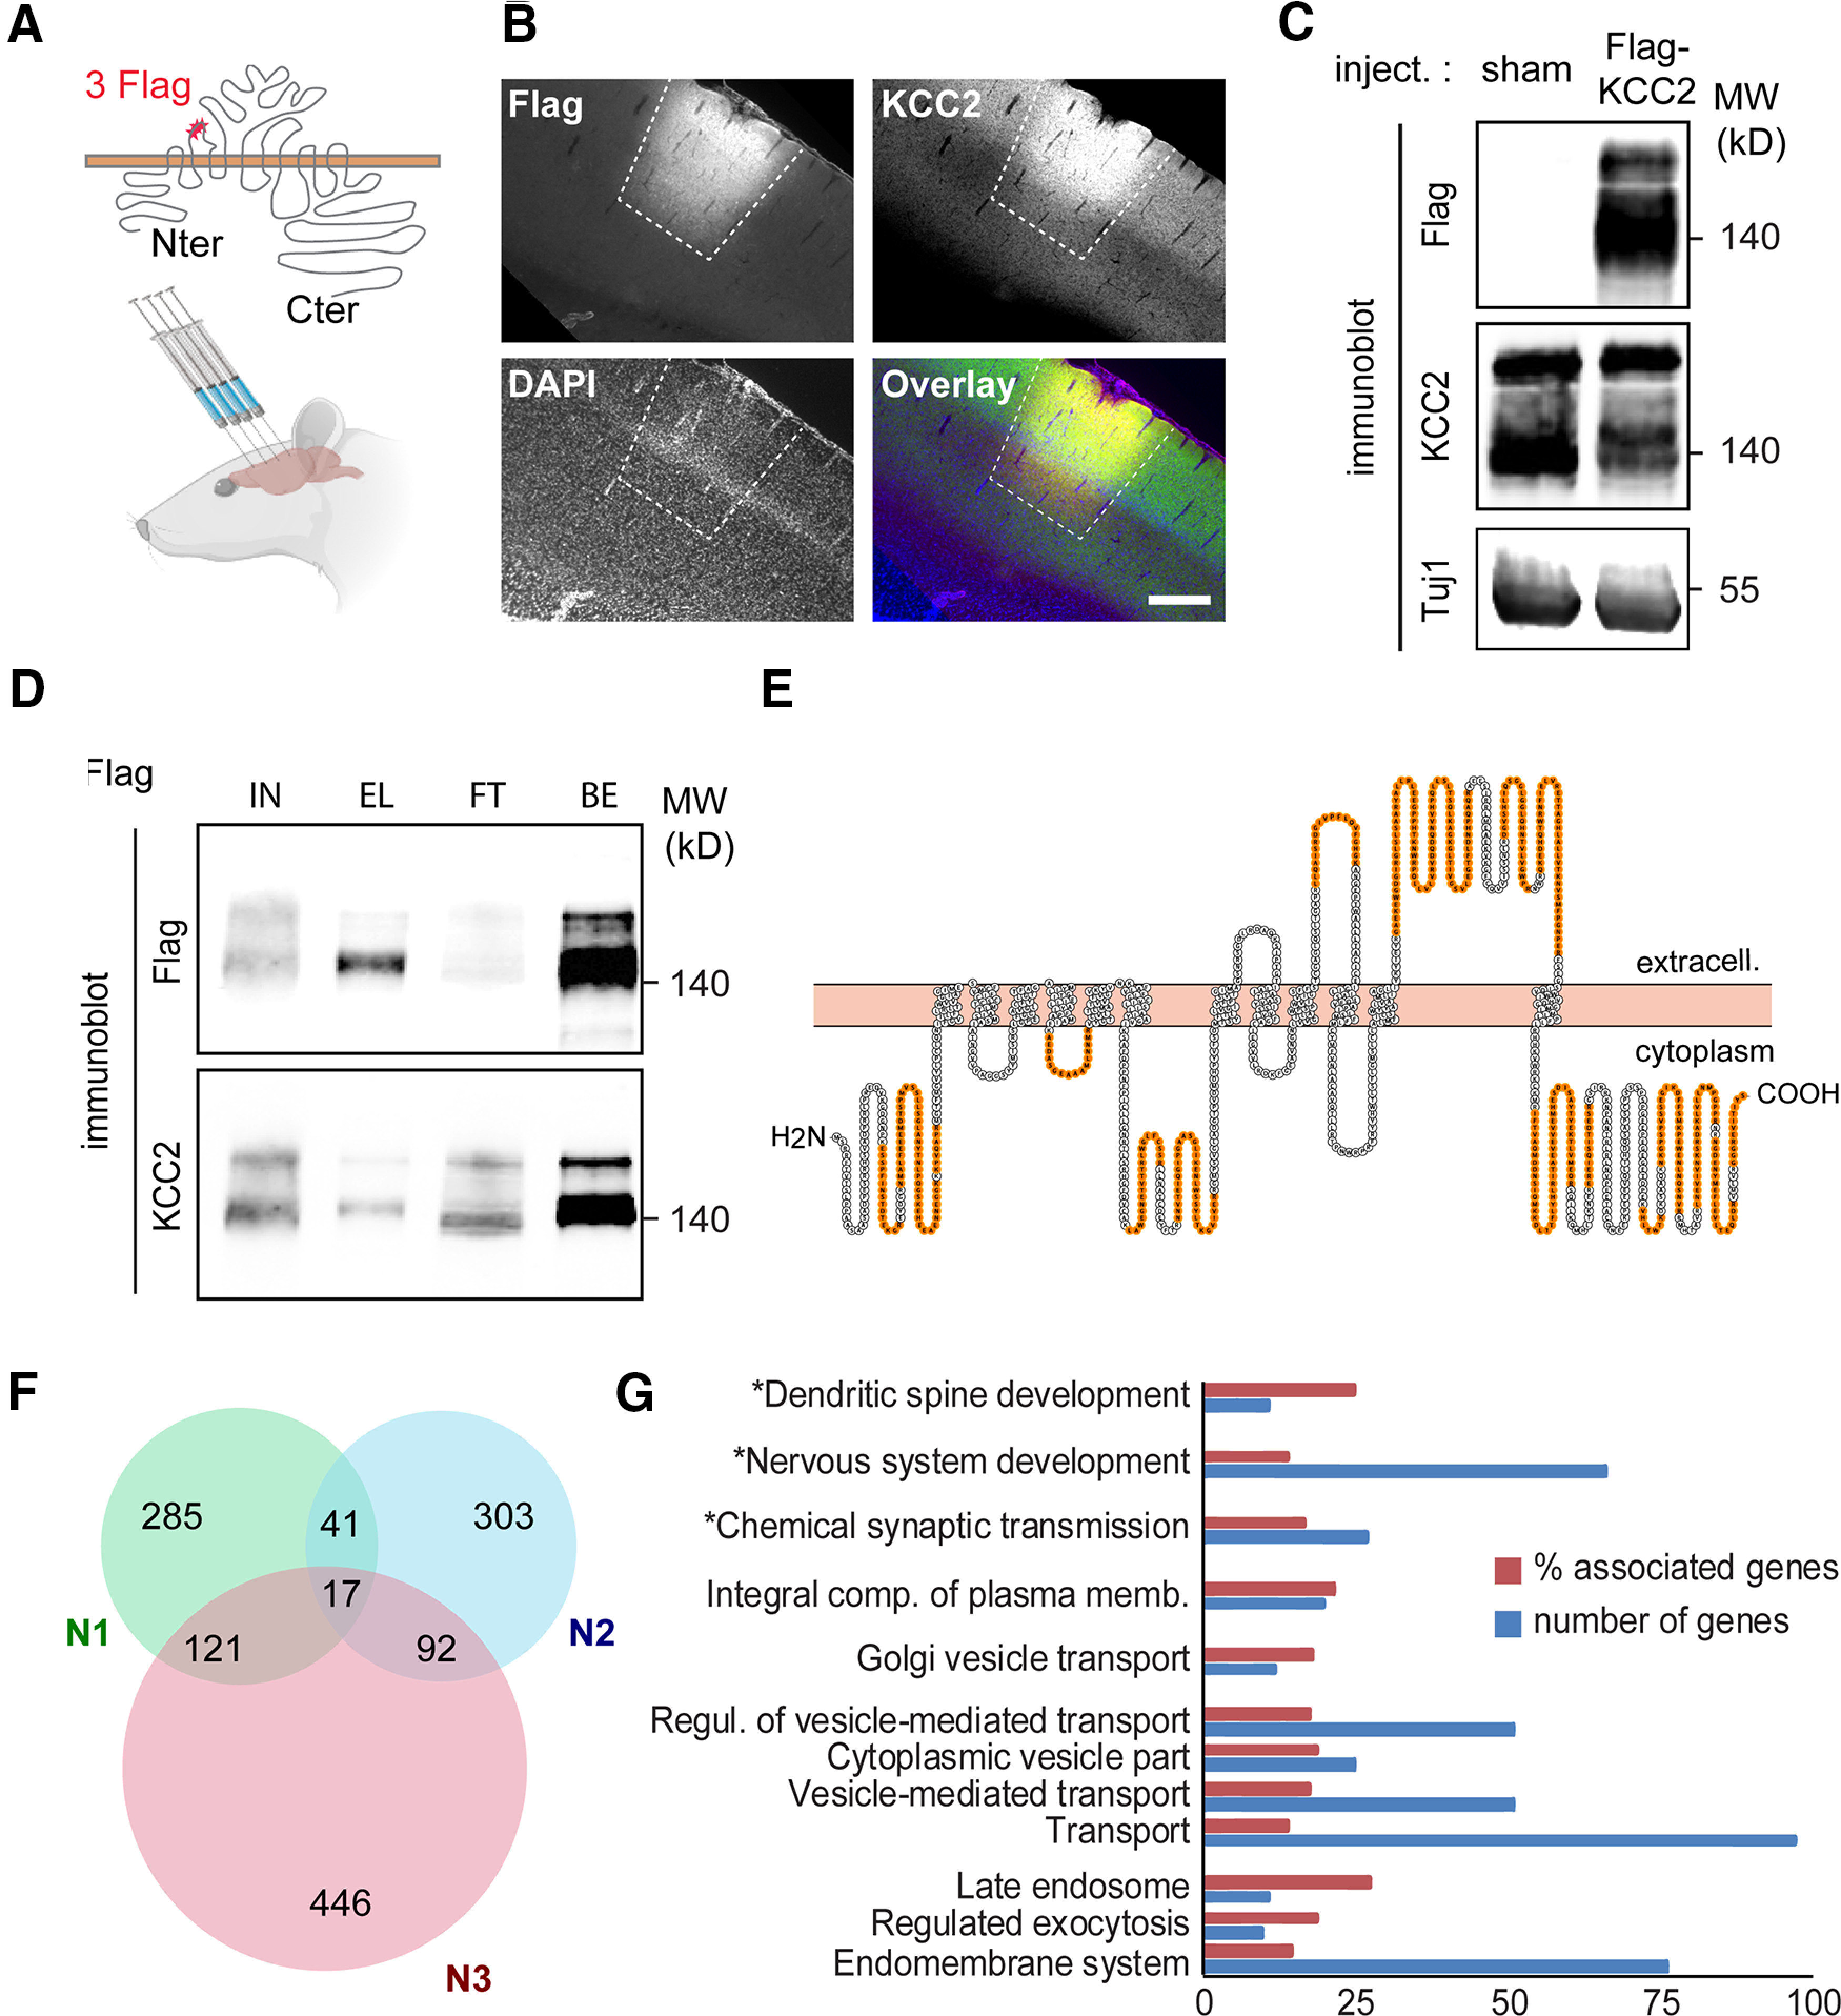
Figure 1.

Recombinant Flag-tagged KCC2 ex vivo interactome. A, Experimental paradigm. An AAV2.1 vector expressing an extracellularly Flag-tagged, full-length rat KCC2b construct was stereotaxically injected in the cortex of young adult rats (four injection sites per animal). Sham animals received carrier (PBS) injection. B, Confocal fluorescent micrographs (and overlay, with DAPI staining, blue) of cortical slices of an infected rat, immunostained with Flag (red) and KCC2 (green) antibodies, showing widespread expression of recombinant Flag-KCC2 at one virus injection site (dashed lines). Scale bar, 250 µm. C, Western blots of protein extracts from cortices of rats infected with Flag-KCC2 expressing AAV (Flag-KCC2) or sham animals (sham), using Flag and KCC2 antibodies, showing massive expression of recombinant KCC2 in the former. D, Western blots of protein extracts from cortices of rats infected with Flag-KCC2-expressing AAV (KCC2), immunoprecipitated with Flag antibody, and probed with Flag (top) and KCC2 (bottom) antibodies, showing specific enrichment of recombinant KCC2 in the EL used for LC-MS/MS analysis. Most of solubilized Flag-KCC2 present in the total lysate (IN, here 50 µg proteins) was immunoprecipitated (EL), as evidenced by the very low Flag signal in the FT fraction. BS, Flag-KCC2 (bait) fraction bound to the beads on elution. E, KCC2 amino acid sequence (from Protter; Omasits et al., 2014) with peptides identified by LC-MS/MS in orange. F, Venn diagram showing the total number of Flag-KCC2 interacting proteins in the three biological replicates (N1, N2, and N3). Proteins identified in at least two of three replicates (n = 271) were considered for further analysis. G, Gene ontology enrichment analysis of the 271-protein list using all identified proteins as a reference list performed with ClueGO. Number of genes, Number of genes from our list that were associated with the GO term; % associated genes, number of genes from our list associated with the GO term divided by the total number of genes associated with the term. Only GO terms with a significant enrichment (right-sided hypergeometric test, p < 0.05) are shown. GO terms comprising KCC2 are marked with an asterisk.
