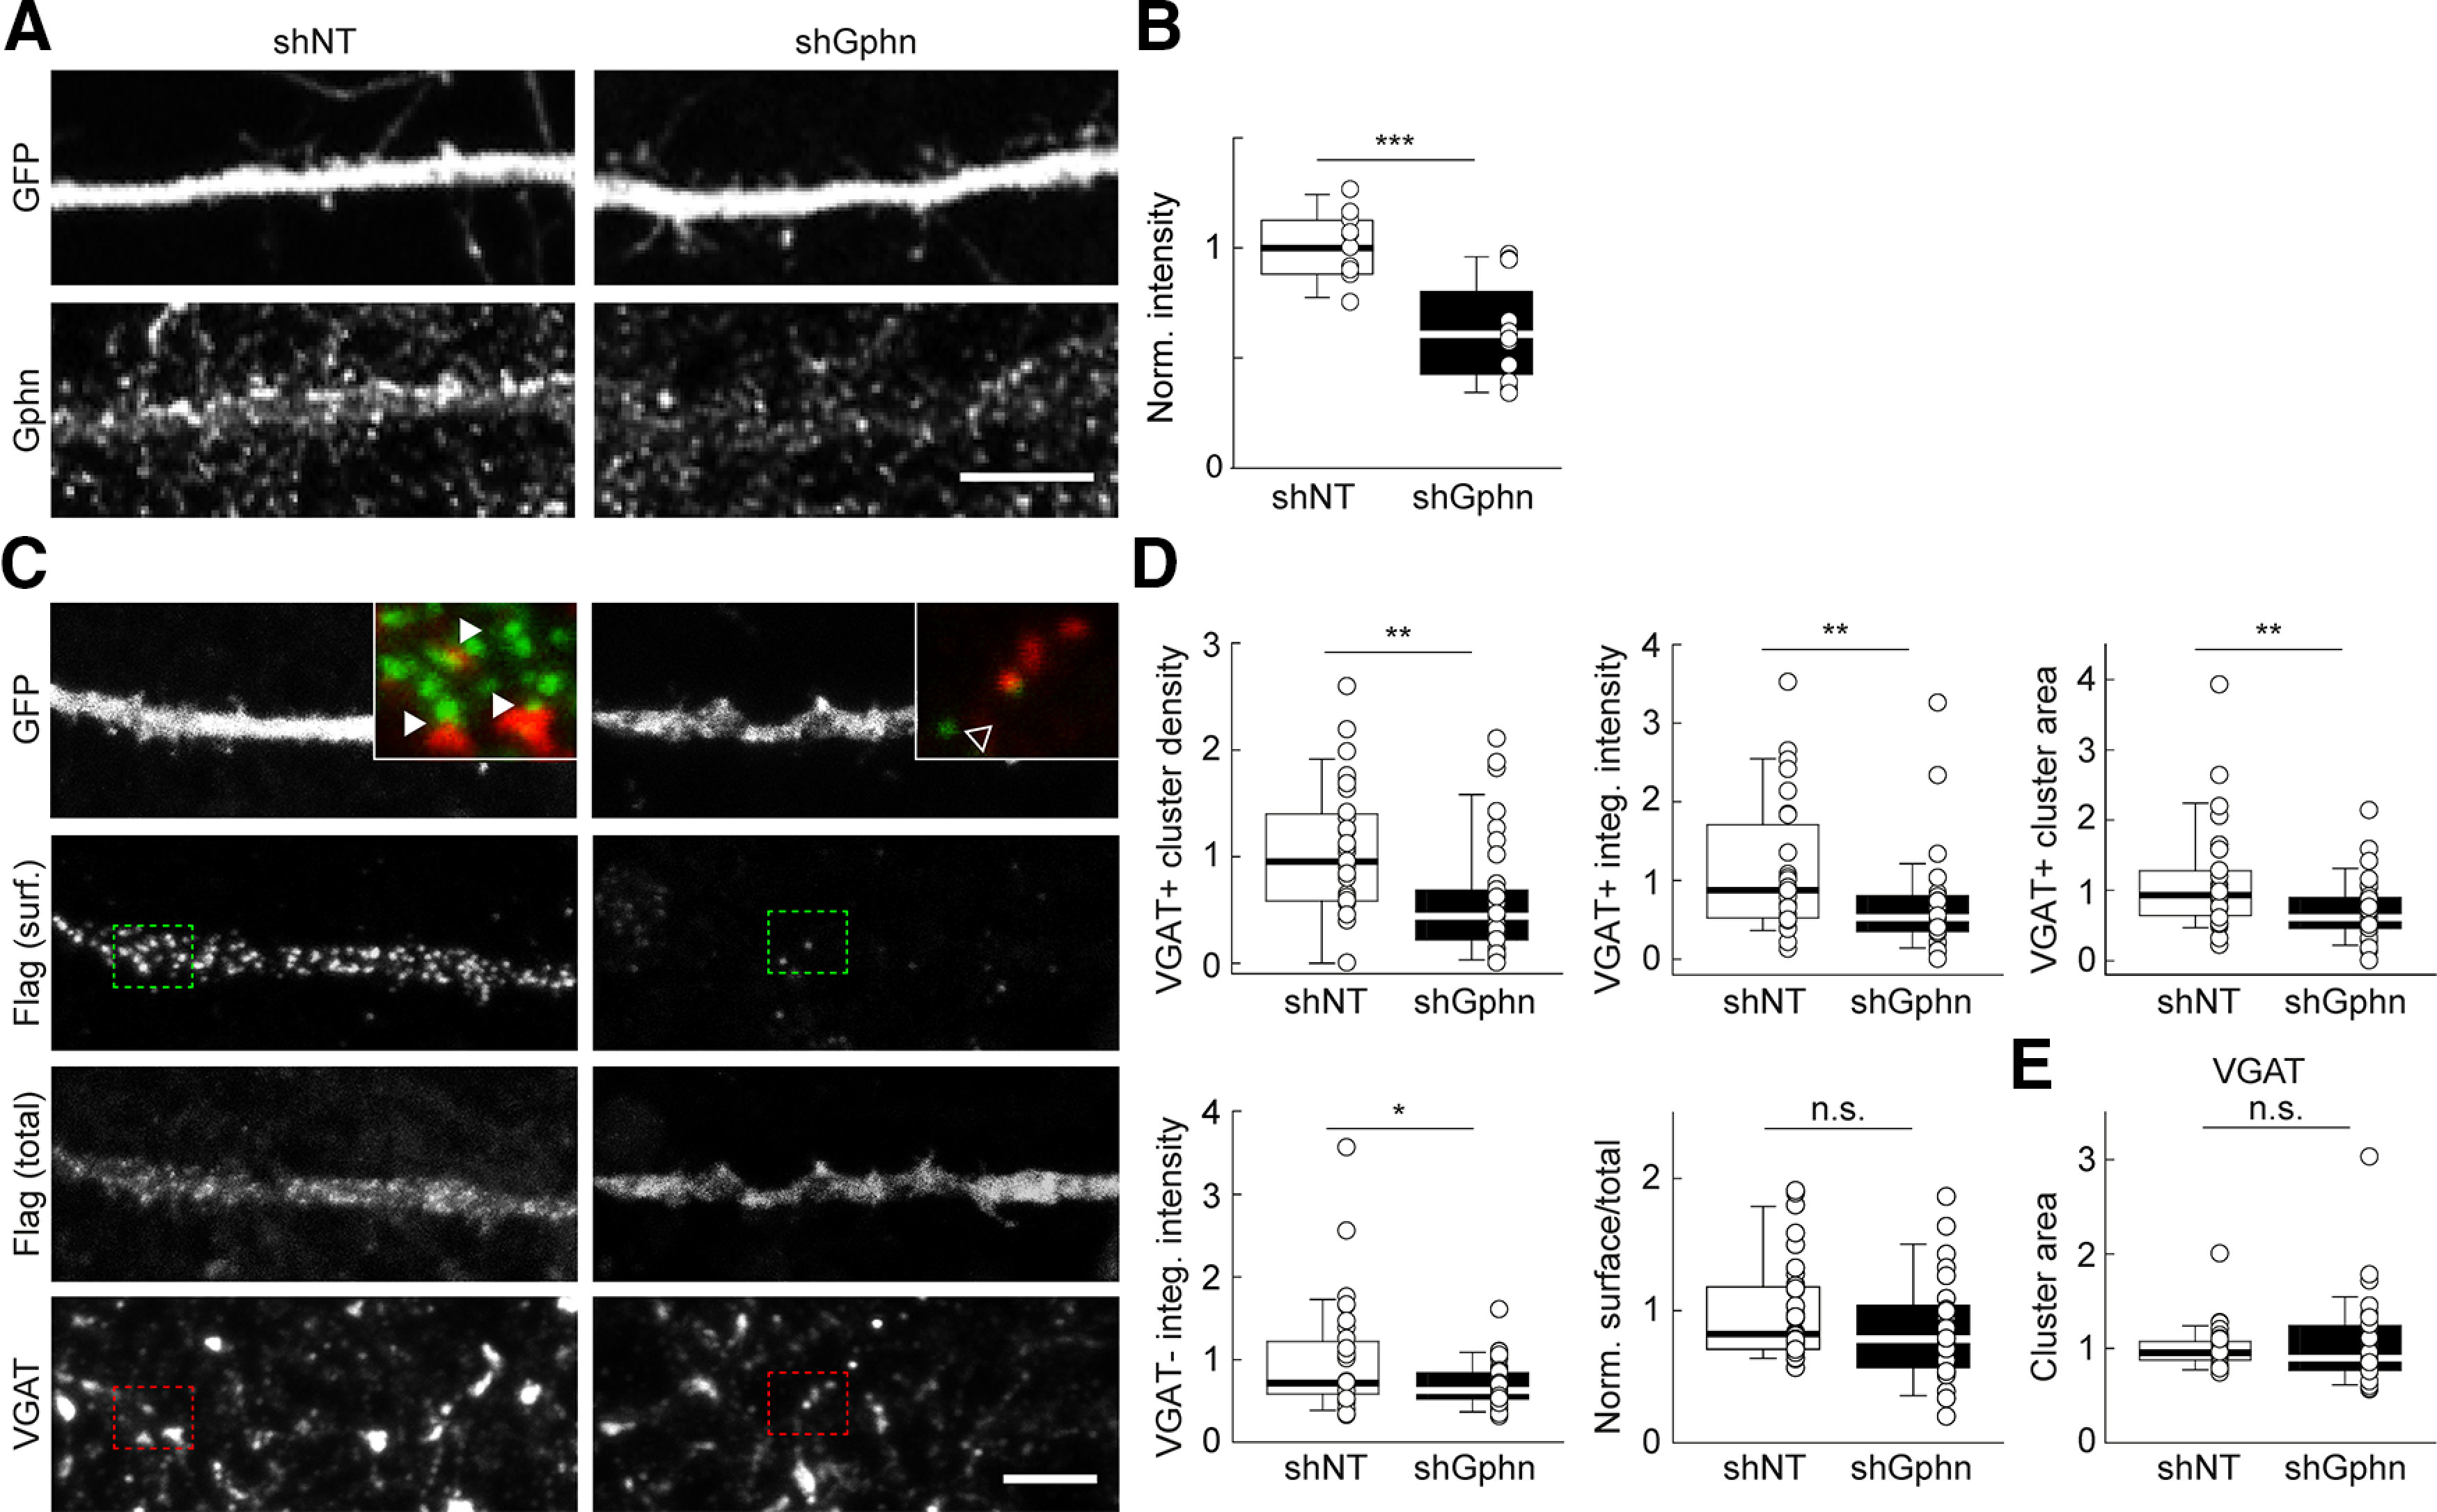
Figure 4.

Gephyrin regulates plasmalemmal KCC2 clustering in hippocampal neurons. A, Representative confocal maximum projection images of dendritic sections of hippocampal neurons transfected with a plasmid encoding GFP and either shNT or shGphn, and immunostained for GFP and gephyrin. Note that dendrites of neighboring, nontransfected neurons display gephyrin immunostaining overlapping with that of transfected neurons. Scale bar, 10 µm. B, Summary boxplots showing the intensity of gephyrin immunofluorescence of neurons transfected with shNT and shGphn, normalized to that of shNT-expressing neurons. ***p < 0.001, Mann–Whitney rank-sum test. C, Representative confocal maximum projection images of hippocampal neurons as in A, after live immunostaining for Flag to probe plasmalemmal recombinant KCC2 [Flag (surf.)] and postfixation immunostaining for Flag [Flag (total)] and VGAT. Insets, overlays of live Flag-KCC2 (red) and postfixation VGAT (green) immunostaining from areas boxed in full-scale images. Note the apposition of surface Flag-KCC2 and VGAT immunofluorescent clusters (arrowheads) in control but not gephyrin knock-down neurons (open arrowhead). Scale bar, 5 µm. D, Summary boxplots showing the properties of Flag-KCC2-immunopositive clusters colocalizing (VGAT+, top three plots) or not (VGAT–, lower left boxplot) with VGAT-immunopositive clusters, all normalized to control (shNT). Gephyrin knock-down neurons showed reduced Flag-KCC2 VGAT+ and VGAT– mean cluster density, intensity, and area. This effect was not accompanied by significant changes in surface/total Flag-KCC2 immunofluorescence (bottom middle boxplot). E, No change in the mean area of VGAT clusters was observed on gephyrin knockdown. shNT, n = 32 cells; shGphn, n = 35 cells; from three independent experiments for cluster analysis (n = 39 and n = 25 cells from three independent experiments for surface/total Flag-KCC2). **p < 0.01, *p < 0.05; Mann–Whitney rank-sum tests.
