
Figure 2.
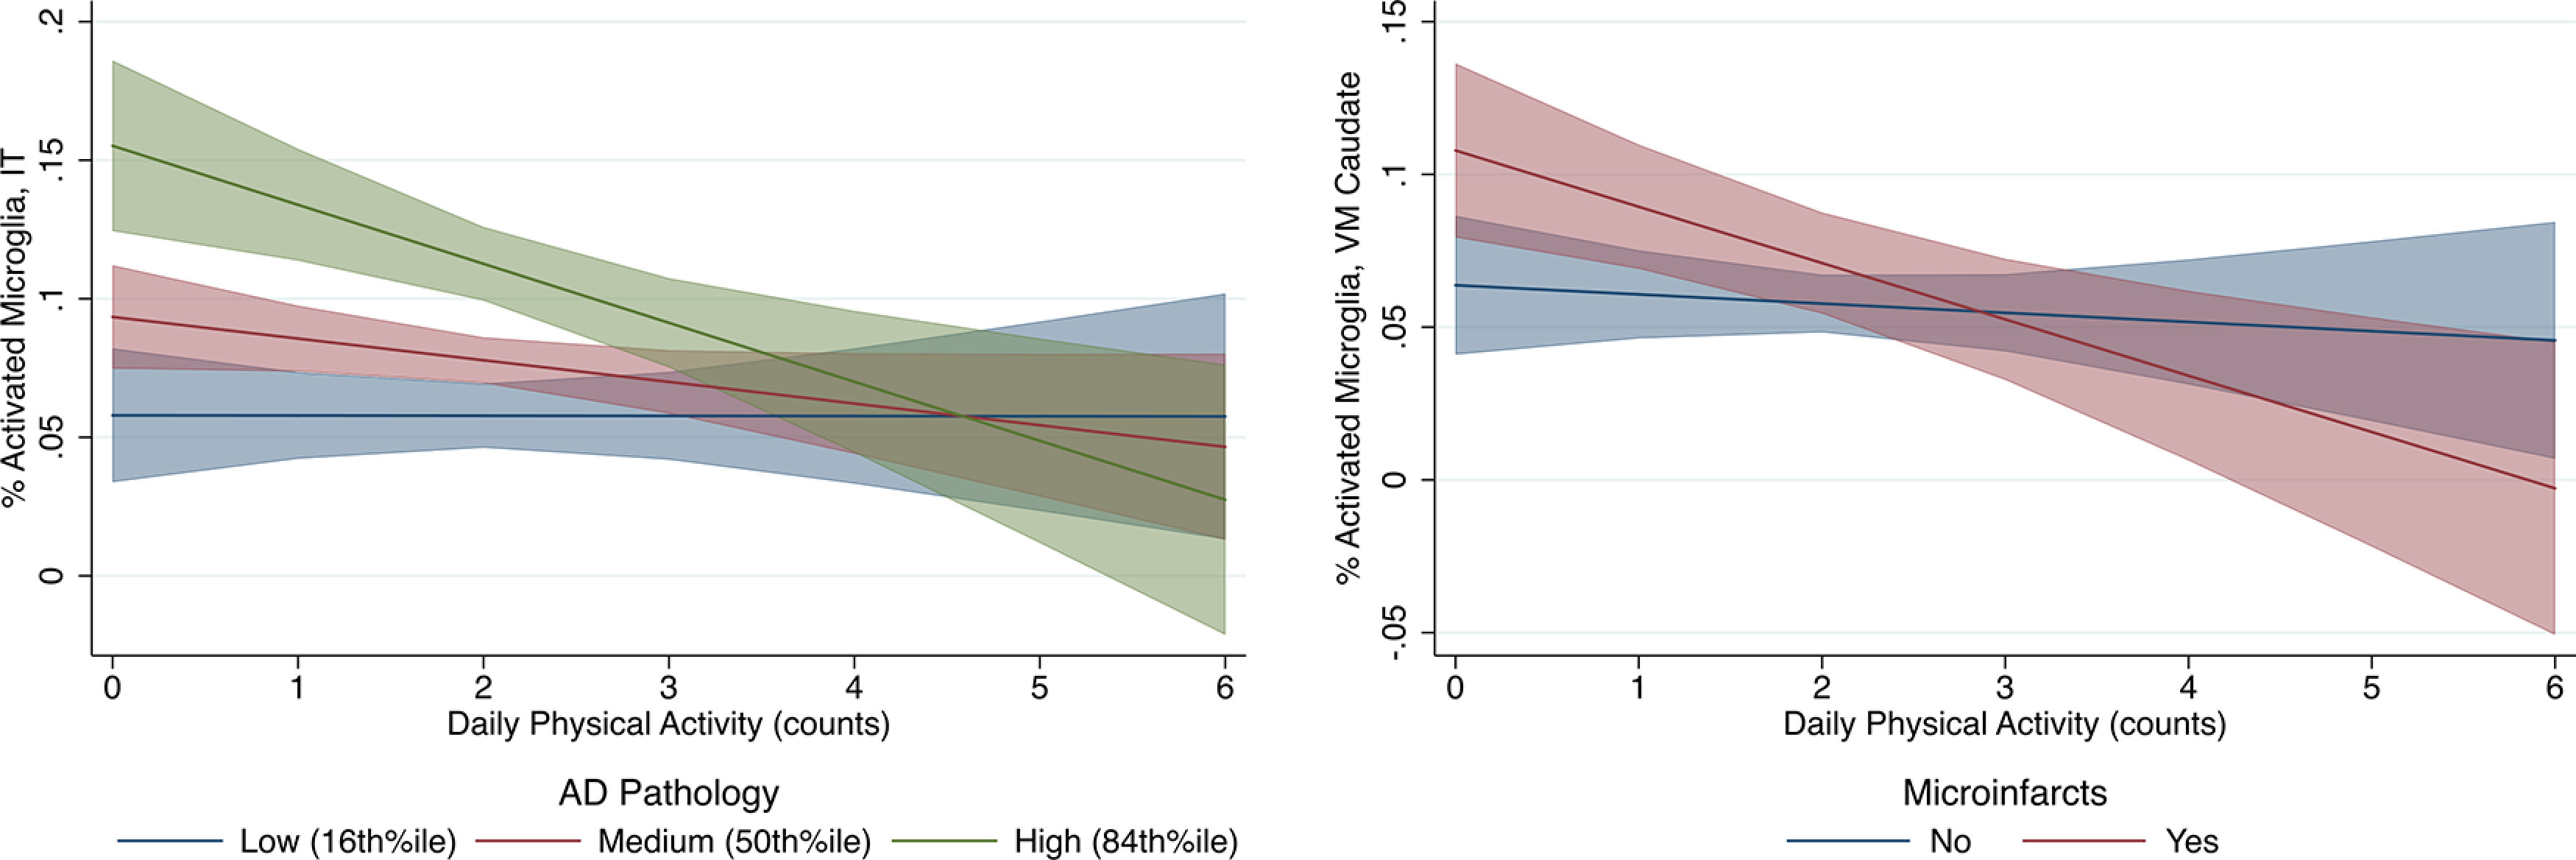
Plots of predicted relationship between physical activity and microglial activation as moderated by pathology. Fitted regression lines and 95% CIs are shown. Interaction regression models adjusted for age, sex, education, and motor10 composite. Daily physical activity counts divided by 1 × 10⁵ (∼1 SD) to facilitate presentation.