Figure 10.

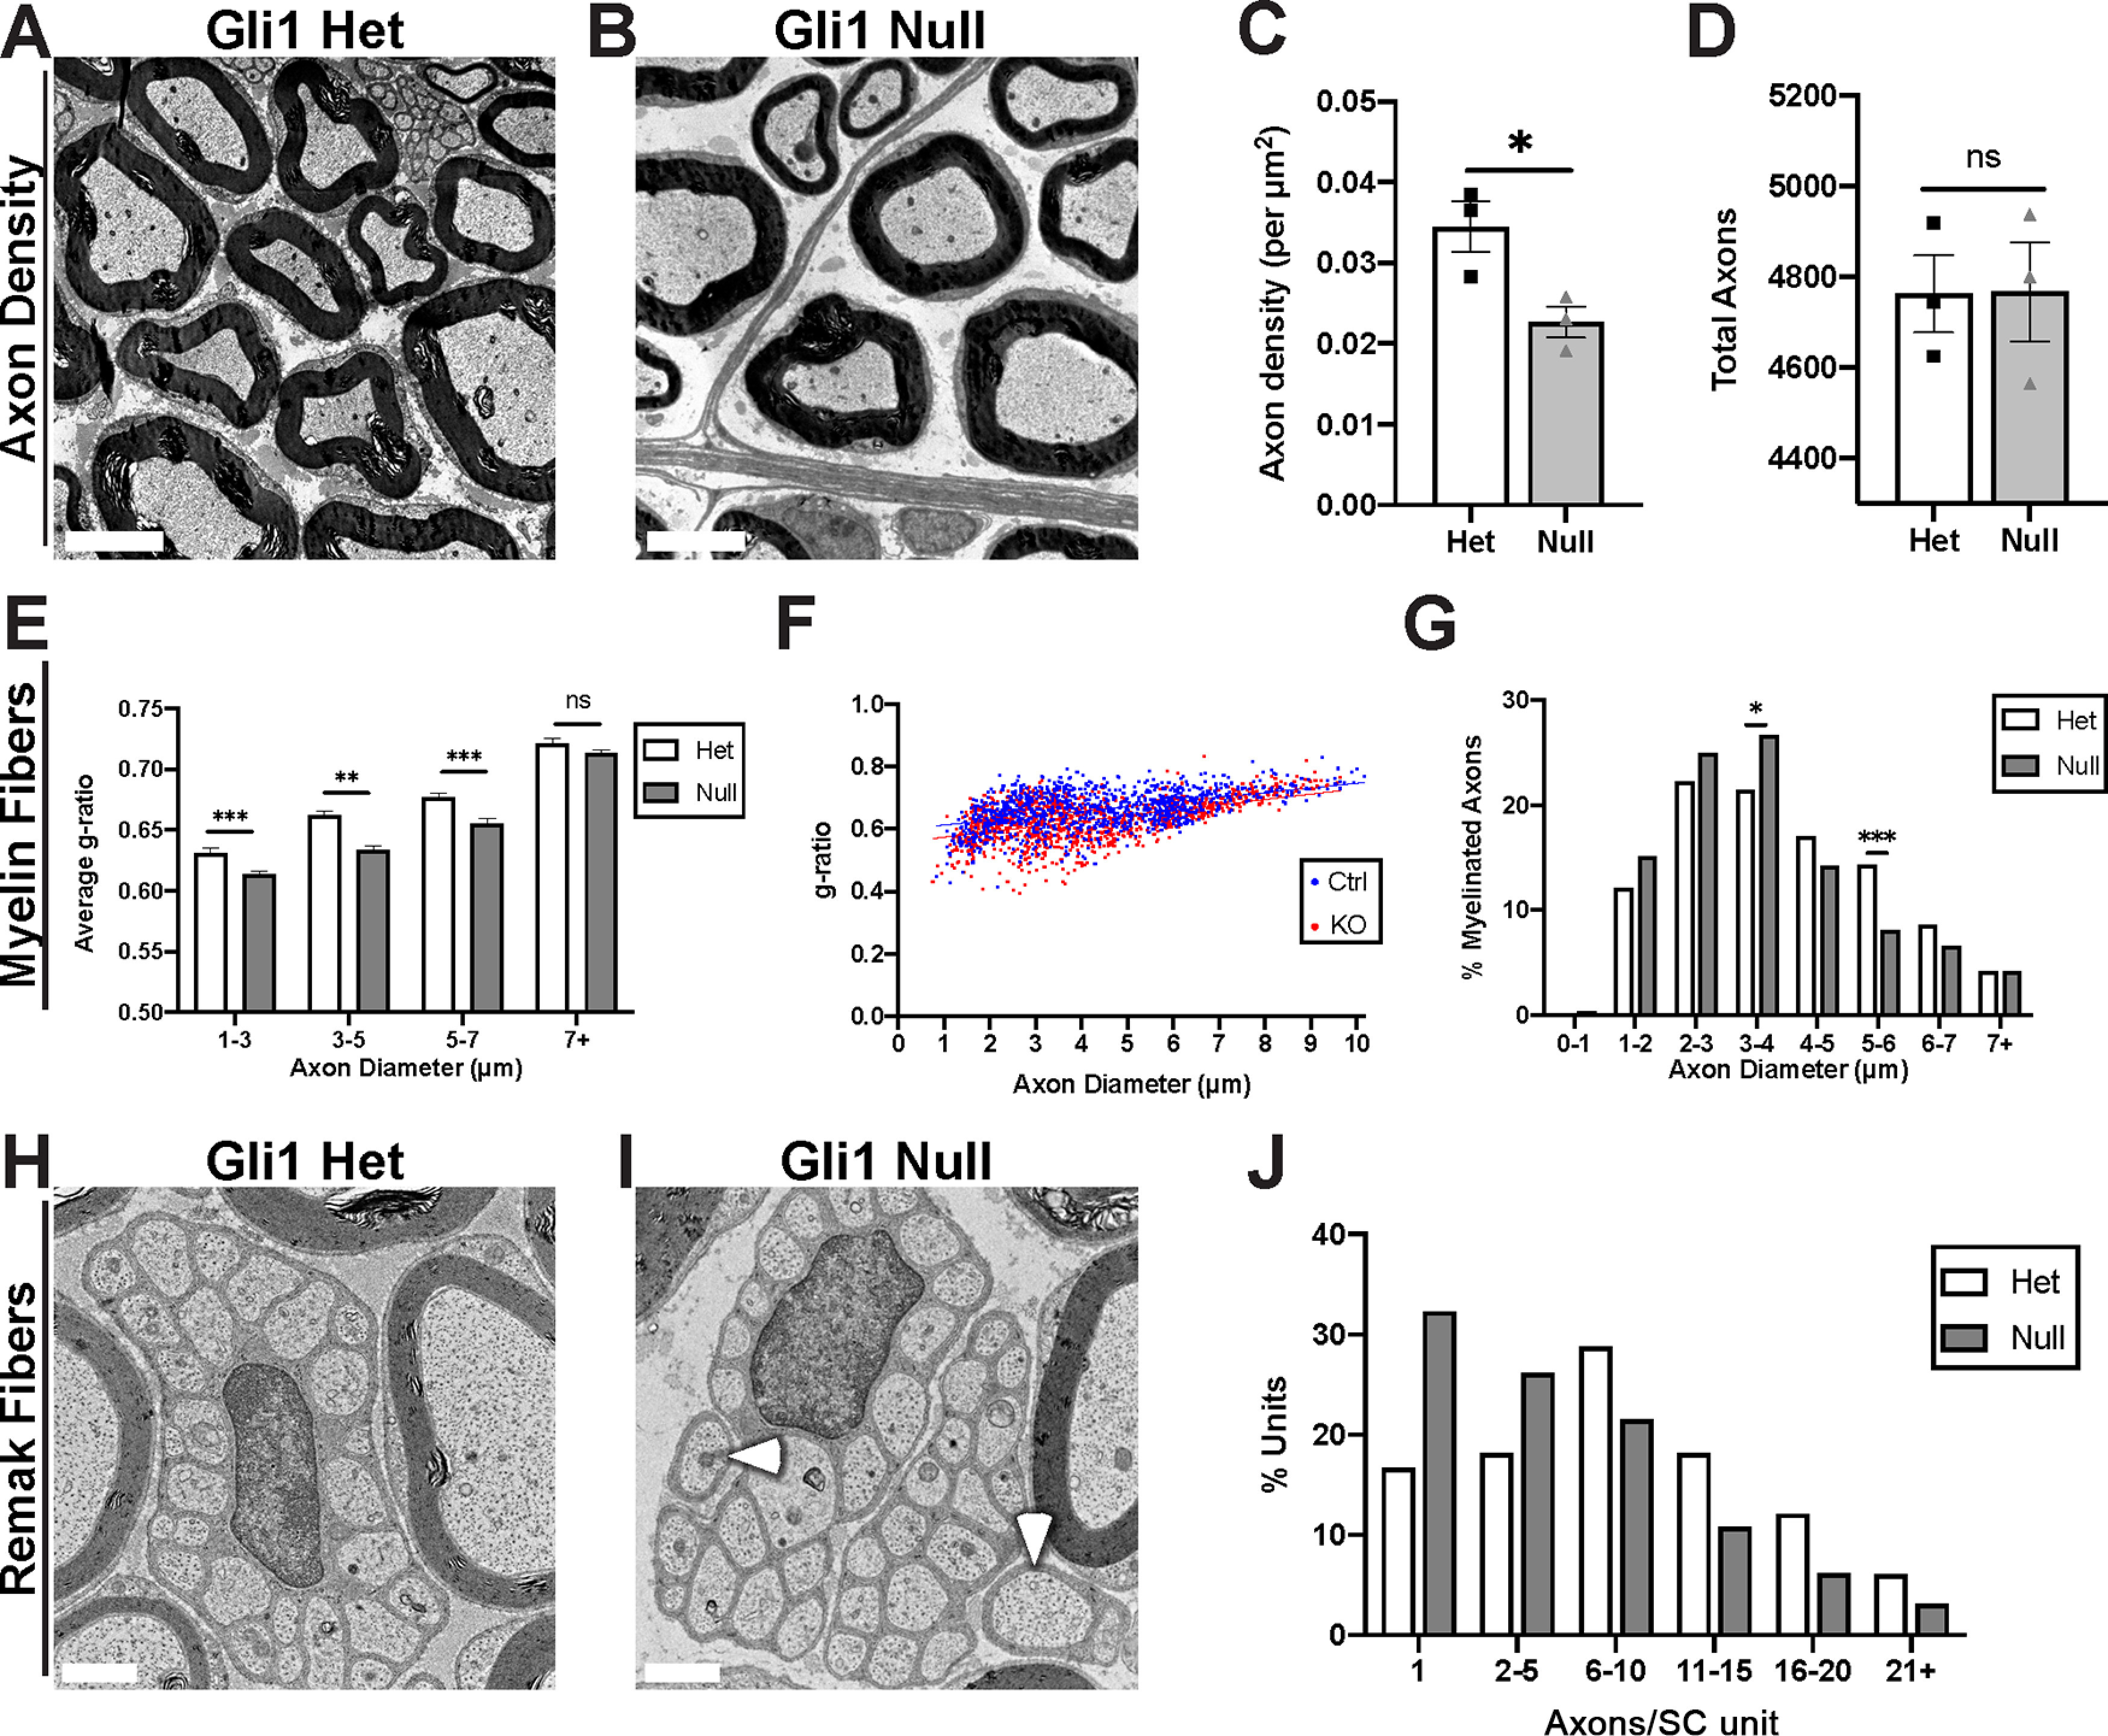
Gli1 expression regulates the morphometry of axon-SC units. A, B, EM cross sections demonstrate increased spacing between axon-SC units in nerves of Gli1 nulls versus hets. C, Calculation of axon density reveals a significant decrease in Gli1 nulls (0.023 ± 0.0019) compared with hets (0.034 ± 0.0031) (p = 0.0424). D, Total axon numbers were similar in Gli1 het (4763 ± 85.38) and null nerves (4564 ± 108.9) (p = 0.98). E, Average g-ratios of myelinated fibers were calculated within the indicated diameter ranges and indicate a modest hypermyelination of small- and medium-size axons in Gli1 nulls. 1-3 μm: Het (0.63 ± 0.004) versus Null (0.61 ± 0.003), p = 0.003; 3-5 μm: Het (0.66 ± 0.003) versus Null (0.63 ± 0.003), p < 0.0001; 5-7 μm: Het (0.67 ± 0.004) versus Null (0.65 ± 0.004), p = 0.0001; 7+ μm: Het (0.72 ± 0.003) versus Null (0.71 ± 0.003), p = 0.081. F, Scatterplot of axon diameter versus g-ratio for single myelinated fibers in adult Gli1 hets and nulls. Distributions are largely overlapping with a slight shift toward lower g-ratios for smaller-diameter axons for Gli1 nulls versus hets. Lines of best fit: Gli1 het (y = 0.015x + 0.60) versus Gli1 null (y = 0.017x + 0.56). G, A shift from larger to smaller axon diameters is observed in Gli1 nulls. p = 0.63 (Total vs 0-1 μm), p = 0.12 (Total vs 1-2 μm), p = 0.31 (Total vs 2-3 μm), p = 0.042 (Total vs 3-4 μm), p = 0.18 (Total vs 4-5 μm), p = 0.0002 (Total vs 5-6 μm), p = 0.13 (Total vs 6-7 μm), p = 0.99 (Total vs 7+ μm). H, I, Remak bundles containing as few as 1-2 axons (I, arrowheads) were frequently observed in Gli1 nulls but not in hets. J, Remak bundles were binned by number of axons per bundle, showing a shift toward lower axon:SC ratios (i.e., 1:1 and 1:2) in Gli1 nulls. C, D, Values shown represent mean ± SEM analyzed using unpaired t test with Welch's correction based on n = 3 biological replicates per genotype. *p < 0.05. E–G, More than 1000 axons across n = 3 biological replicates per genotype were traced. E, Axons were binned by diameter, and average g-ratio was analyzed by t test as above. G, Axon diameters were binned as a percentage of total axons measured and analyzed by Fisher's exact test. *p < 0.05. **p < 0.01. ***p < 0.001. J, More than 150 Remak bundles per genotype were analyzed. The number of observations was insufficient for Fisher's testing. Scale bars: A, B, 5 μm; H, I, 1 μm.
