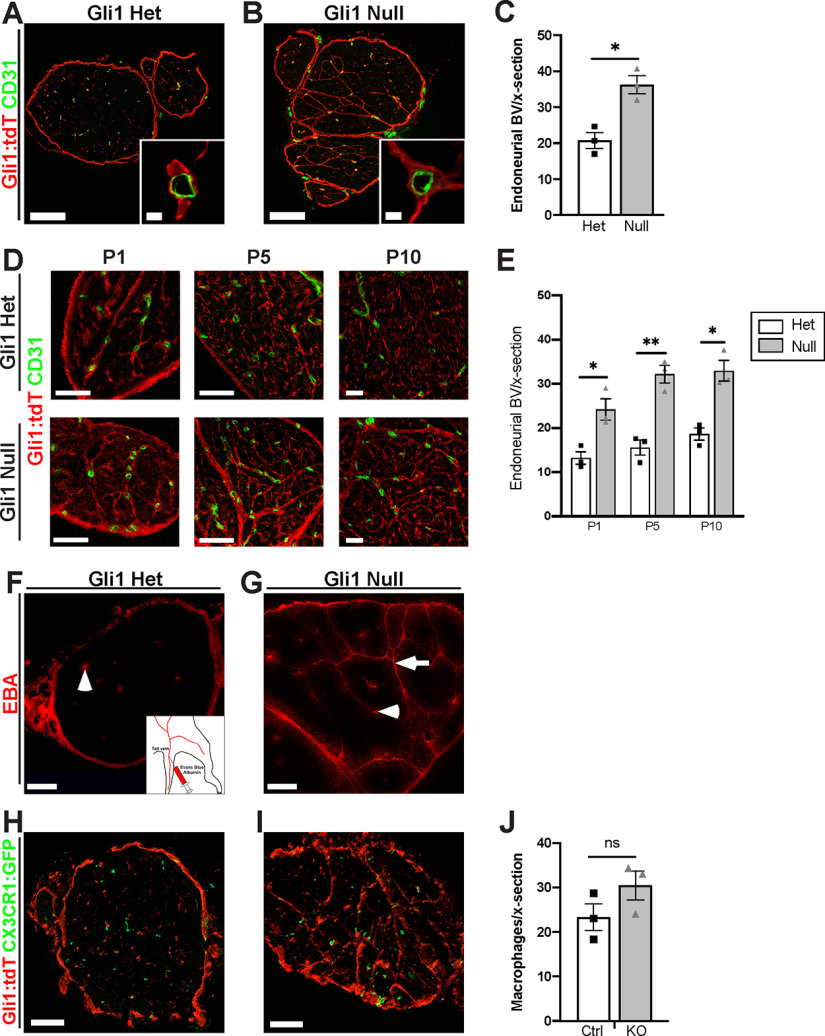
Figure 8.
Gli1 expression controls peripheral nerve vascularization. A, B, Sciatic nerve sections from adult fate mapped Gli1 hets and nulls (tdT, red) were stained for the EC marker CD31 (green). Vessels are surrounded by Gli1-positive cells in both hets and nulls. C, Density of CD31+ vessels is significantly increased in adult Gli1 nulls (36.22 ± 2.50) versus hets (20.78 ± 2.21) (p = 0.010). D, Nerve cross sections from Gli1 het or null mice at the indicated postnatal time points were stained for tdT and CD31. Blood vessels are closely associated with tdT-positive cells starting at P1 in both genotypes; MFs surround endoneurial vessels in Gli1 nulls. E, Quantification shows vasculature is significantly increased in Gli1 nulls starting at P1 and persisting into adulthood. P1: Het (13.22 ± 1.42) versus Null (24.22 ± 2.41) (p = 0.025); P5: Het (15.63 ± 1.71) versus Null (32.22 ± 2.00) (p = 0.0035); P10: Het (18.67 ± 1.39) versus Null (33.00 ± 2.34) (p = 0.011). F, G, Nerve cross sections from Gli1 het and null mice injected intravenously with EBA (red) show that the dye is contained within endoneurial vessels in both Gli1 hets and nulls (arrowheads). Dye also diffuses along MFs in Gli1 nulls (arrow) but does not penetrate into the endoneurium. H, I, Nerve sections from Gli1 het and null fate mapped mice were crossed with the CX3CR1EGFP/+ reporter line to label macrophages with GFP. J, The density of macrophages was not significantly altered in Gli1 nulls (30.44 ± 3.25) versus hets (23.33 ± 2.99) (p = 0.18). Values shown represent mean ± SEM analyzed using unpaired t test with Welch's correction based on n = 3 biological replicates per genotype. *p < 0.05. **p < 0.01. Scale bars: A, B, 100 μm; A, B, insets, 5 μm; D, 50 μm; F-I, 100 μm.

