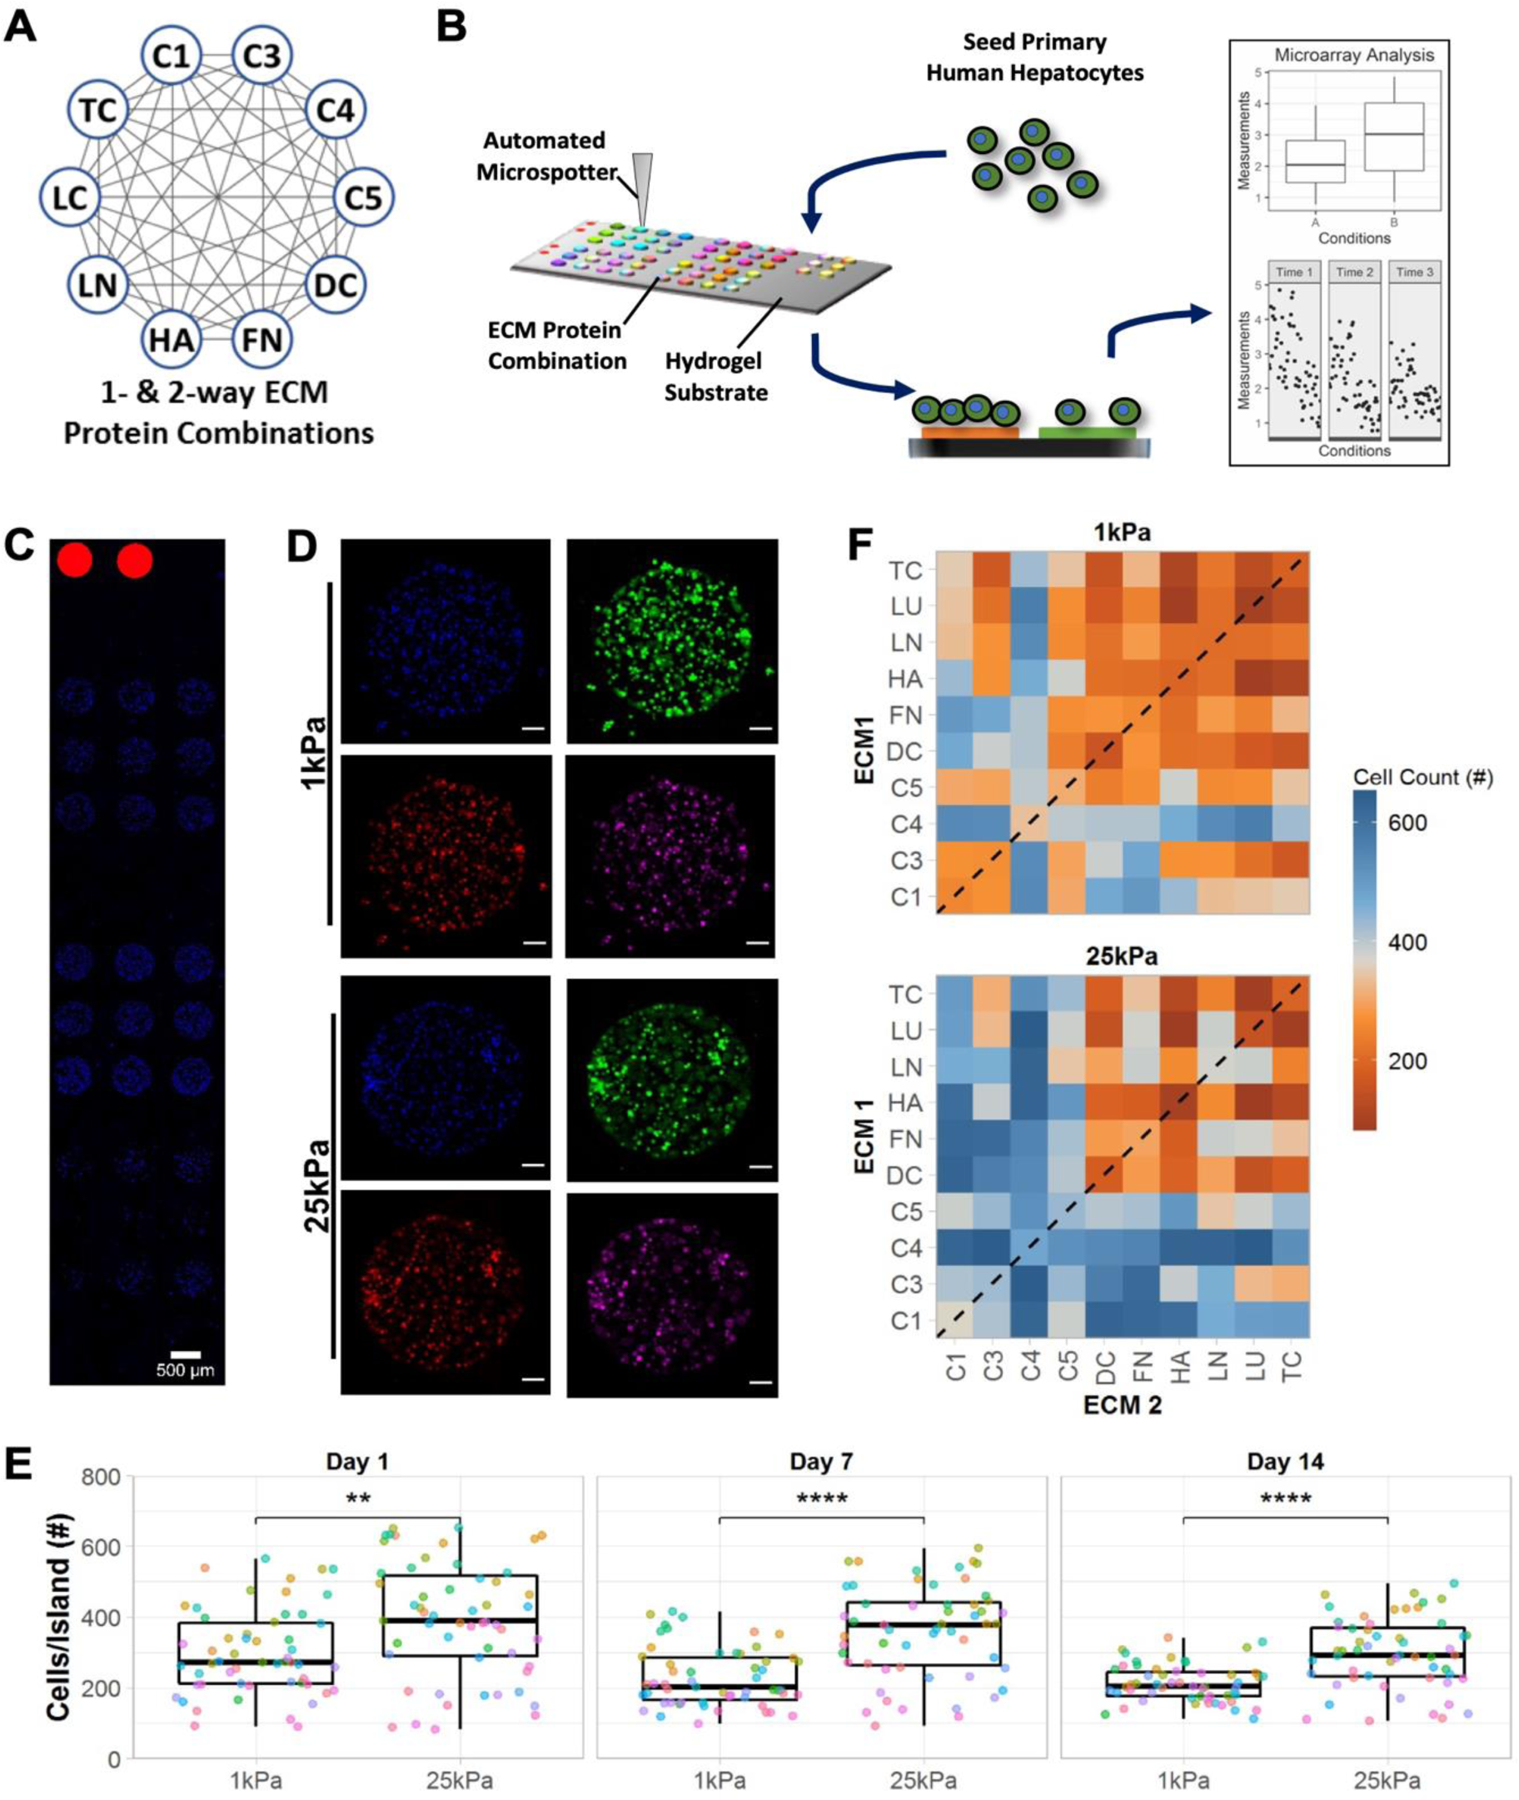
Figure 1. High-throughput extracellular matrix (ECM) microarrays for probing primary human hepatocyte (PHH) attachment and phenotype.

A) Single- and two-way combinations of 10 liver-inspired recombinant ECM proteins. Each circle represents a single protein (collagens 1 [C1], 3 [C3], 4 [C4], 5 [C5] decorin [DC], fibronectin [FN], hyaluronic acid [HA], laminin [LN], lumican [LC], and tenascin [TC]) and each grey line represents a two-way protein combination; a total of 55 compositions of ECM proteins were utilized in this study. B) Schematic of the experimental workflow, including: fabrication of microarrays using an automated microspotter to transfer pre-made ECM protein solutions to a polyacrylamide (PA) hydrogel of a tunable stiffness conjugated to a glass slide; seeding of PHHs that attach only to the ECM protein ‘islands’ and not to the PA gel; differential attachment of PHHs and expression of PHH markers on ECM islands as assessed via high-content imaging; plotting and statistical analysis of single cell imaging data across the various ECM conditions. C) Representative section of an ECM microarray demonstrating the differential attachment of PHHs to ECM islands of 450 µm diameter; nuclei are counterstained with DAPI and rhodamine-labeled dextran spots on microarrays are utilized for alignment. Scale bar = 500 µm. D) Representative islands of 4-color-stained PHHs on the microarrays of two different PA stiffnesses, 1 kPa and 25 kPa (Young’s moduli). Scale bars = 50 µm. E) Box plots showing the median number of cells per ECM island (center bar) along with the interquartile range on both microarray stiffnesses over 14 days of culture (each dot represents the mean cell number measured across islands of a specific ECM composition); mean distributions were compared across the stiffnesses using the Wilcoxon Test. **p<0.01 and ****p<0.0001. F) Heatmap of mean cell number across islands of single- (dashed line) and two-way combinations of the ECM proteins on the two stiffnesses after 14 days of culture. Similar heatmaps after 1 and 7 days of culture are shown in Figure S1A, Supporting Information. For panels E and F, data displayed represents summarized single-cell measurements across three PHH donors per condition (n = 22–24 ECM islands across representative microarrays).
