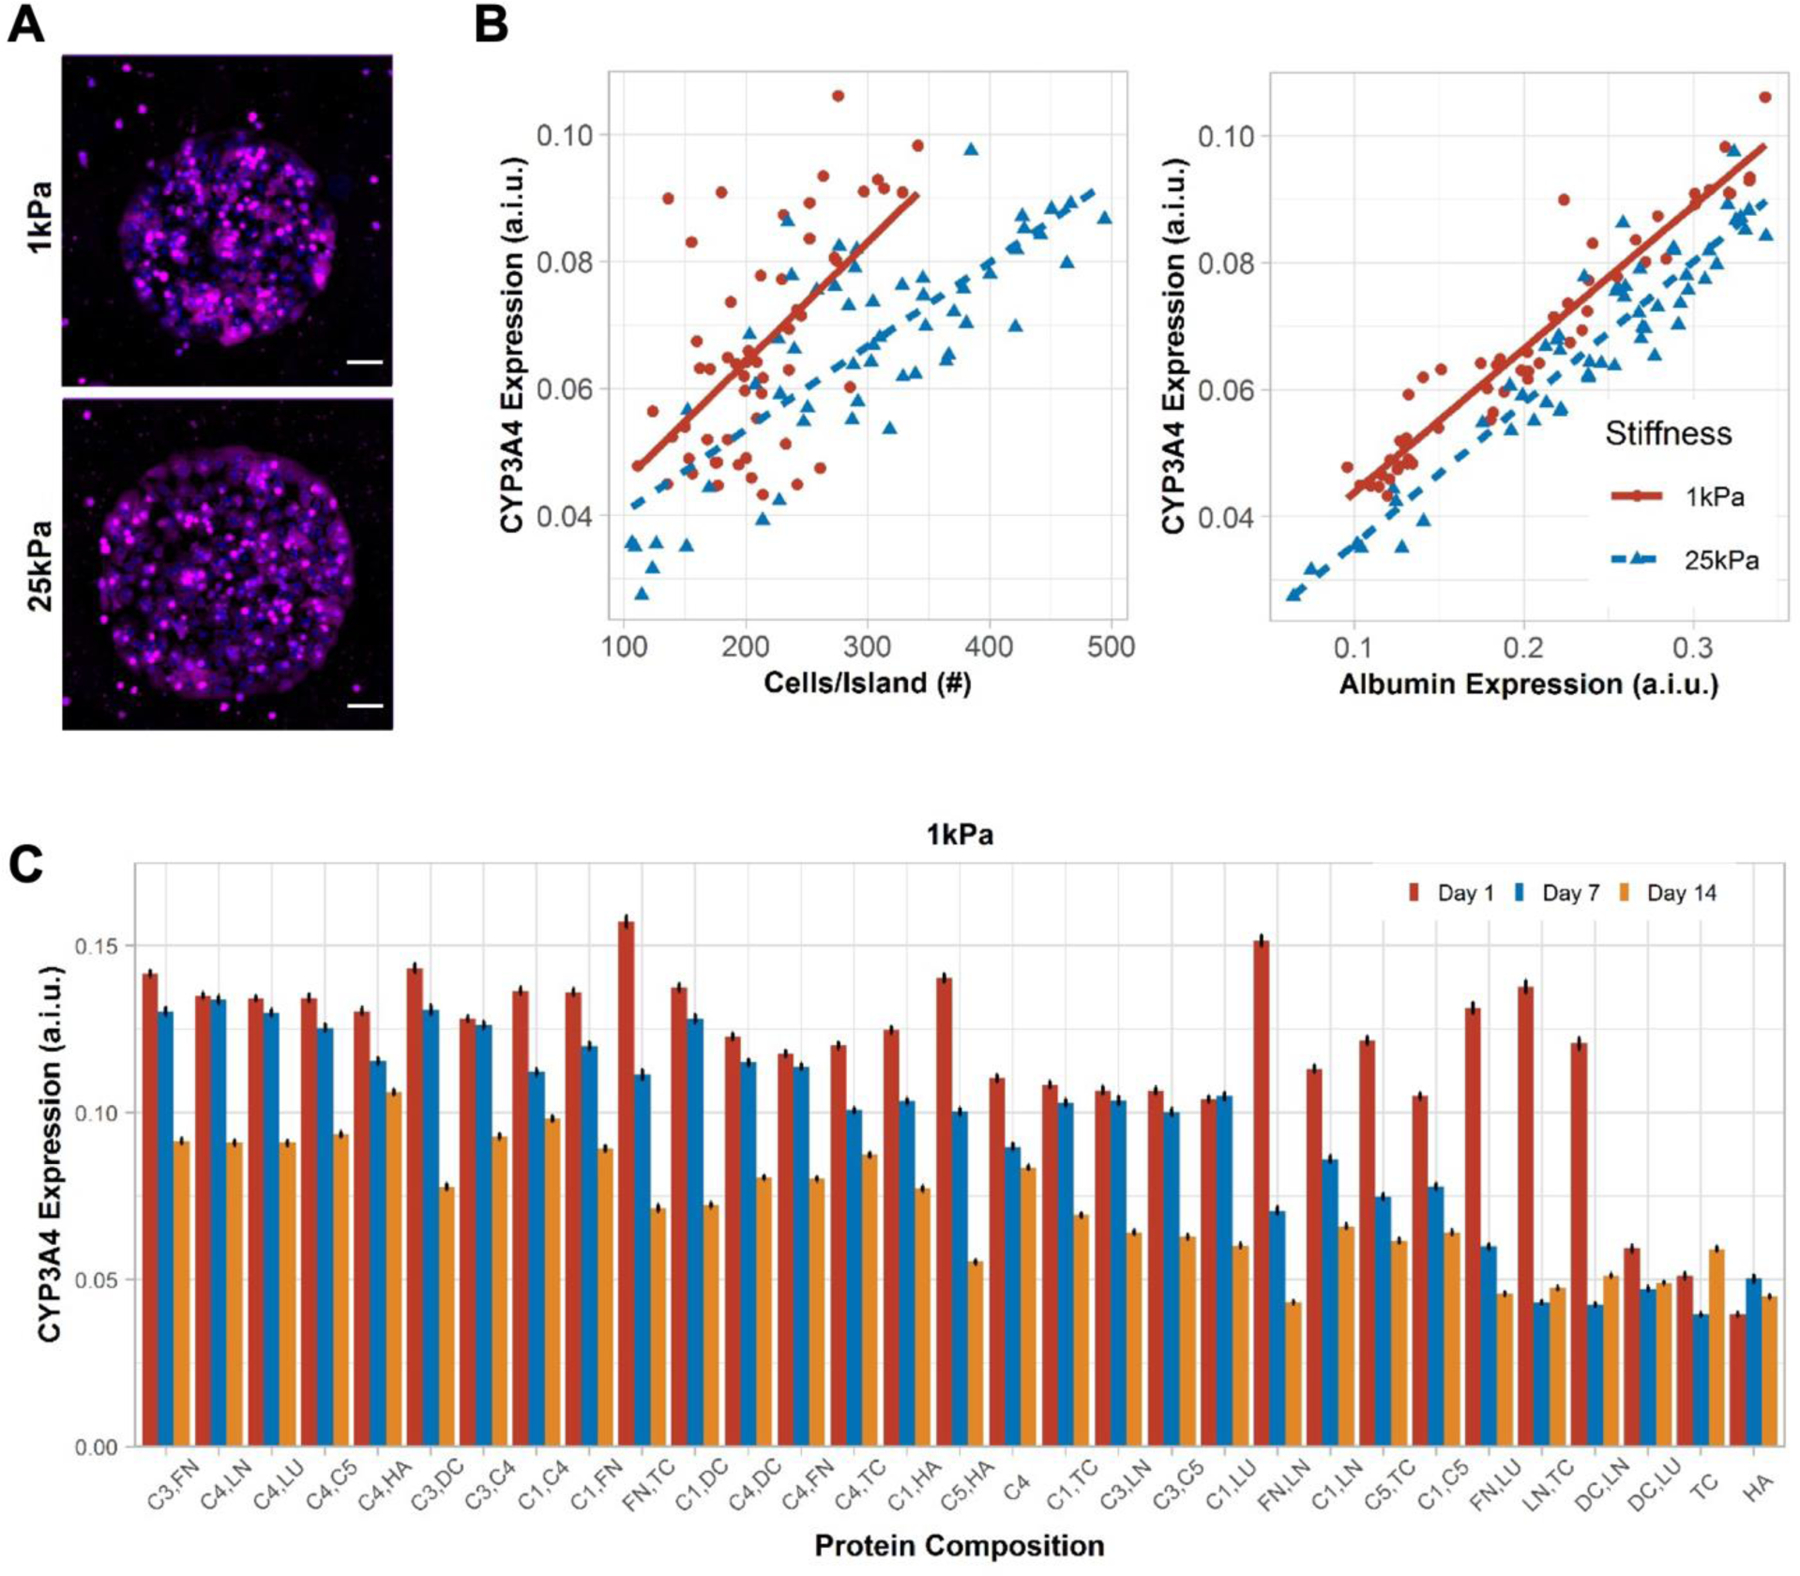
Figure 3. CYP3A4 expression in primary human hepatocytes (PHHs) on extracellular (ECM) microarrays.

A) Representative images of CYP3A4 expression in PHHs after 14 days of culture on the microarrays of two different stiffnesses, 1 kPa and 25 kPa. Scale bars = 50 µm. B) Positive correlation was observed between mean cells per ECM island and mean CYP3A4 expression on 1 kPa (rs=0.51, p=9.4e-05) and 25 kPa (rs=0.72, p<2.2e-16) stiffnesses. Similarly, mean albumin expression positively correlates with mean CYP3A4 expression on 1kPa (rs=0.97, p<2.2e-16) and 25 kPa (rs=0.91, p<2.2e-16) stiffnesses. A.i.u. = arbitrary intensity units. C) Bar plot shows the mean CYP3A4 expression in PHHs on those ECM compositions that retained greater than 200 cells per island after 14 days of culture on 1 kPa stiffness. Similar bar plot on microarray of 25 kPa stiffness is shown in Figure S3B, Supporting Information. Error bars represent standard error of mean. For panels B-C, data displayed represents summarized single-cell measurements across three PHH donors per condition (n = 22–24 ECM islands across representative microarrays).
