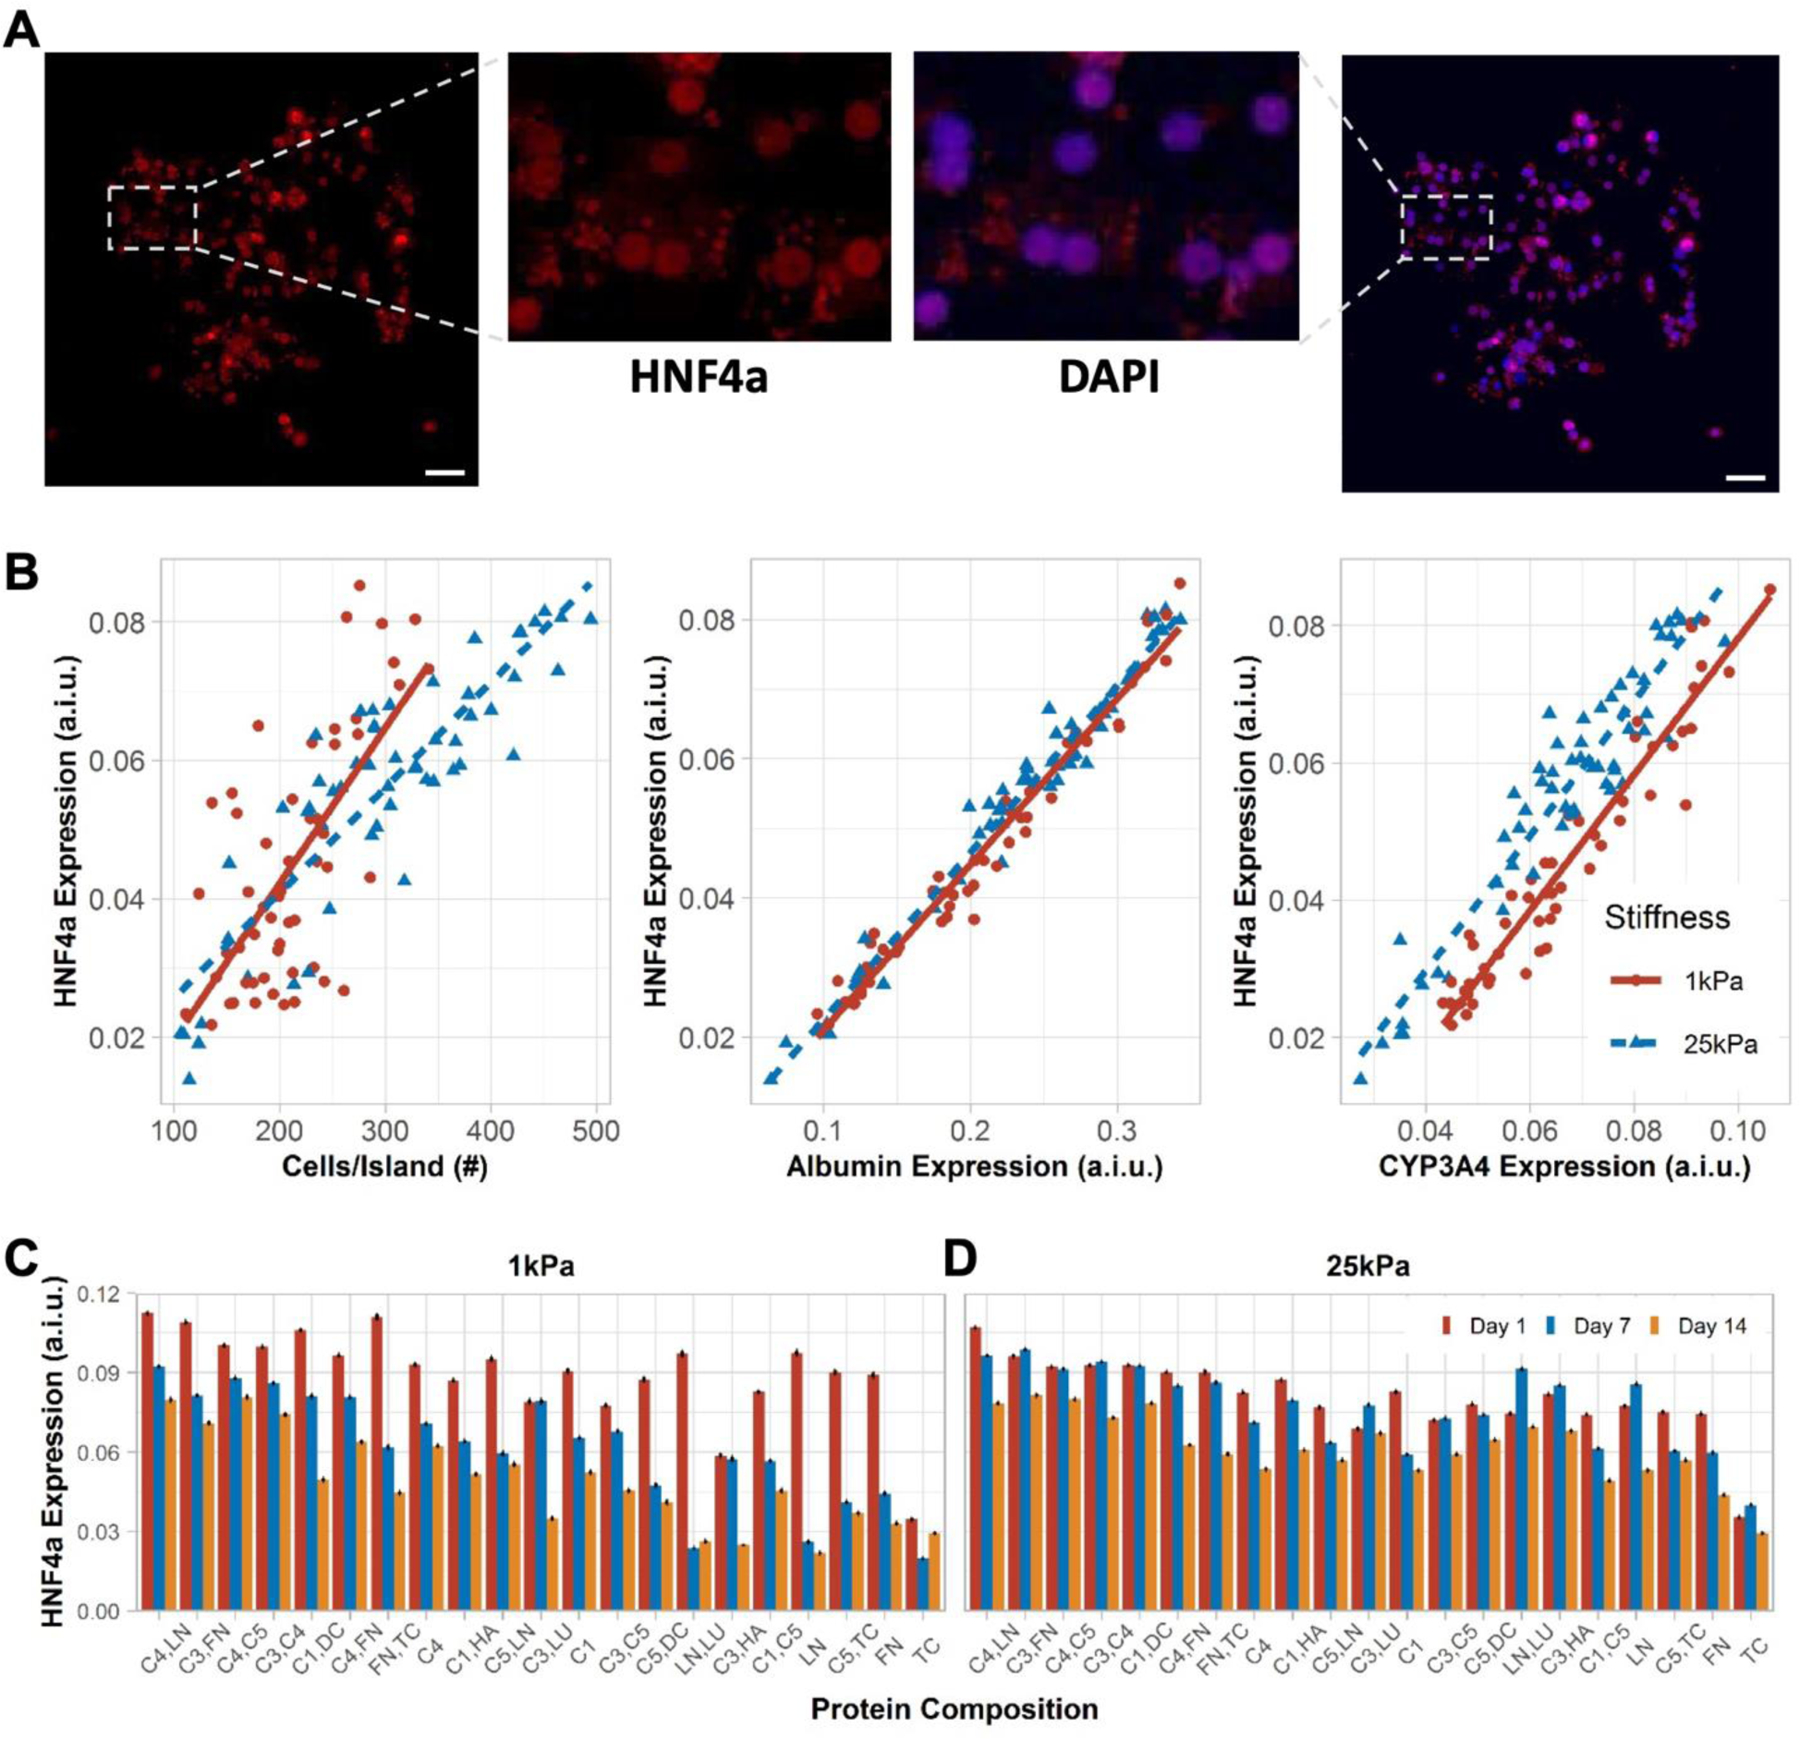
Figure 4. HNF4α expression in primary human hepatocytes (PHHs) on extracellular (ECM) microarrays.

A) A representative island of PHHs shows HNF4α (transcription factor) expression overlaying with the nuclear stain. Scale bars = 50 µm. B) Positive correlation was observed between mean cells per ECM island and mean HNF4α expression on 1 kPa (rs=0.59, p=3.2e-06) and 25 kPa (rs=0.85, p<2.2e-16) stiffnesses. Similarly, mean albumin expression positively correlates with mean HNF4α expression on 1 kPa (rs=0.98, p<2.2e-16) and 25 kPa (rs=0.97, p<2.2e-16) stiffnesses. Lastly, mean CYP3A4 expression positively correlates with mean HNF4α expression on 1 kPa (rs=0.96, p<2.2e-16) and 25 kPa (rs=0.9, p<2.2e-16) stiffnesses. A.i.u. = arbitrary intensity units. C) Bar plots show the mean HNF4α expression in PHHs on representative ECM compositions after 14 days of culture on 1 kPa and D) 25 kPa stiffnesses. Error bars represent standard error of mean. For panels B-D, data displayed represents summarized single-cell measurements across three PHH donors per condition (n = 22–24 ECM islands across representative microarrays).
