
Figure 5. Rank ordering the effects of extracellular matrix (ECM) protein composition and stiffness on primary human hepatocyte (PHH) attachment and albumin expression.
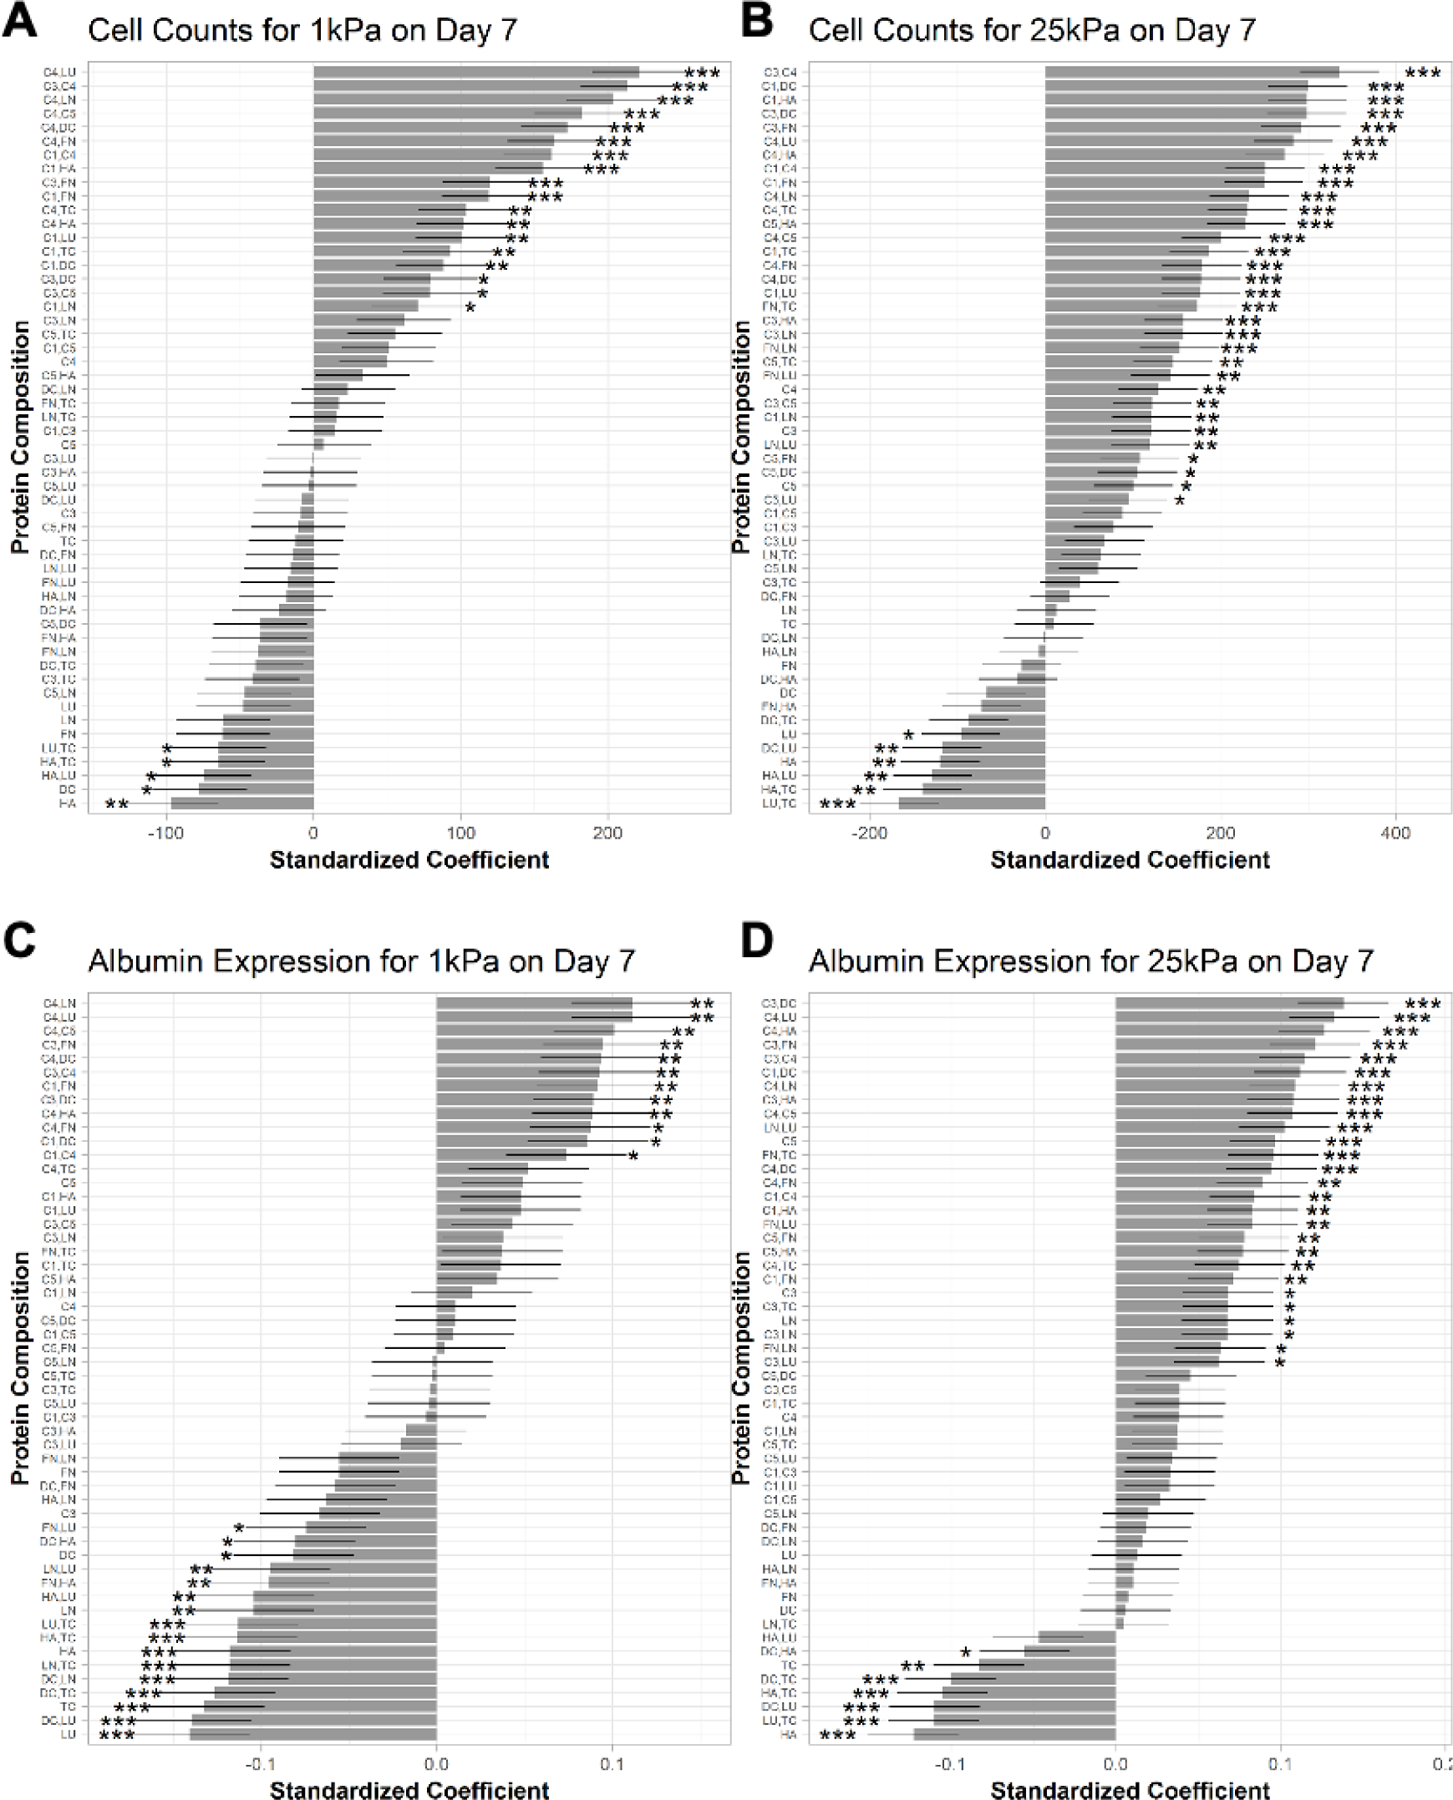
A) Multiple linear regression model for the effects of the ECM protein combinations on mean cells per ECM island after 7 days of culture on microarrays of 1 kPa and B) 25 kPa stiffnesses. C) Effects of the ECM protein combinations on mean albumin expression after 7 days of culture on 1 kPa and D) 25 kPa stiffnesses. Conditions are ranked in descending order based on the corresponding standardized coefficient. Similar rank orderings for CYP3A4 and HNF4α are shown in Figure S5, Supporting Information. Error bars represent standard error. *p ≤ 0.01, **p ≤ 0.001, and ***p ≤ 0.0001. For all panels, data displayed represents summarized single-cell measurements across three PHH donors per condition (n = 22–24 ECM islands across representative microarrays).